Gartner, Inc.'s management explains the business in its own materials. The slides below do the most of that work, pulled from the documents preserved in Sources. Each source link opens the complete presentation at that slide in a new tab.
Gartner's most current earnings deck; the only presentation format it publishes. Carries full-year 2025 columns, so it doubles as the whole-business primer. · Open the full document →
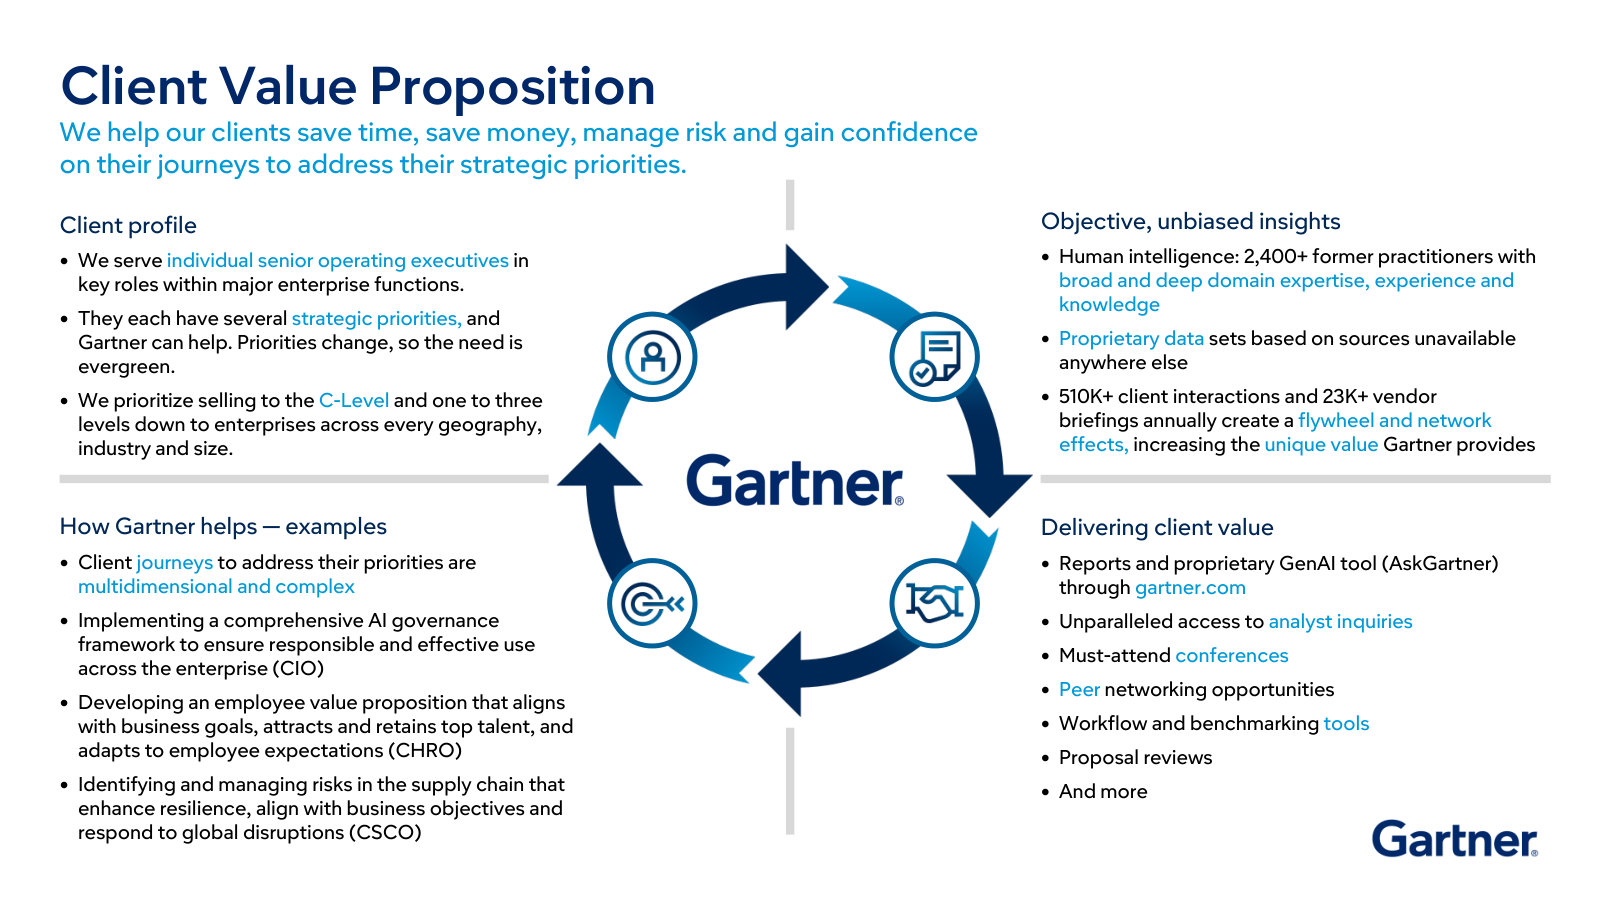
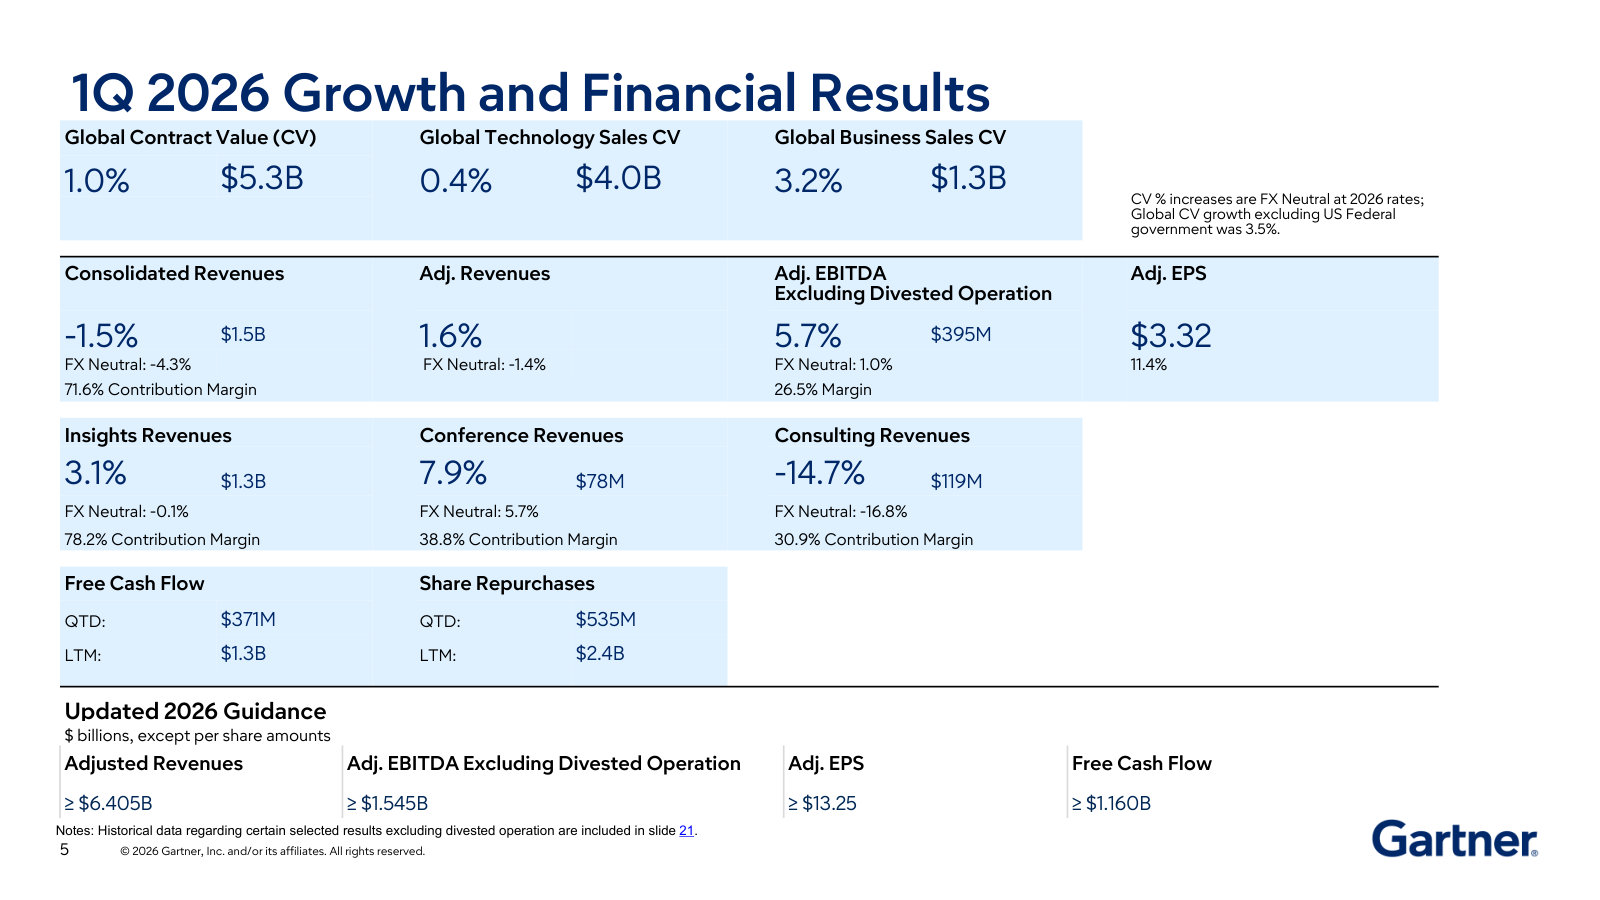
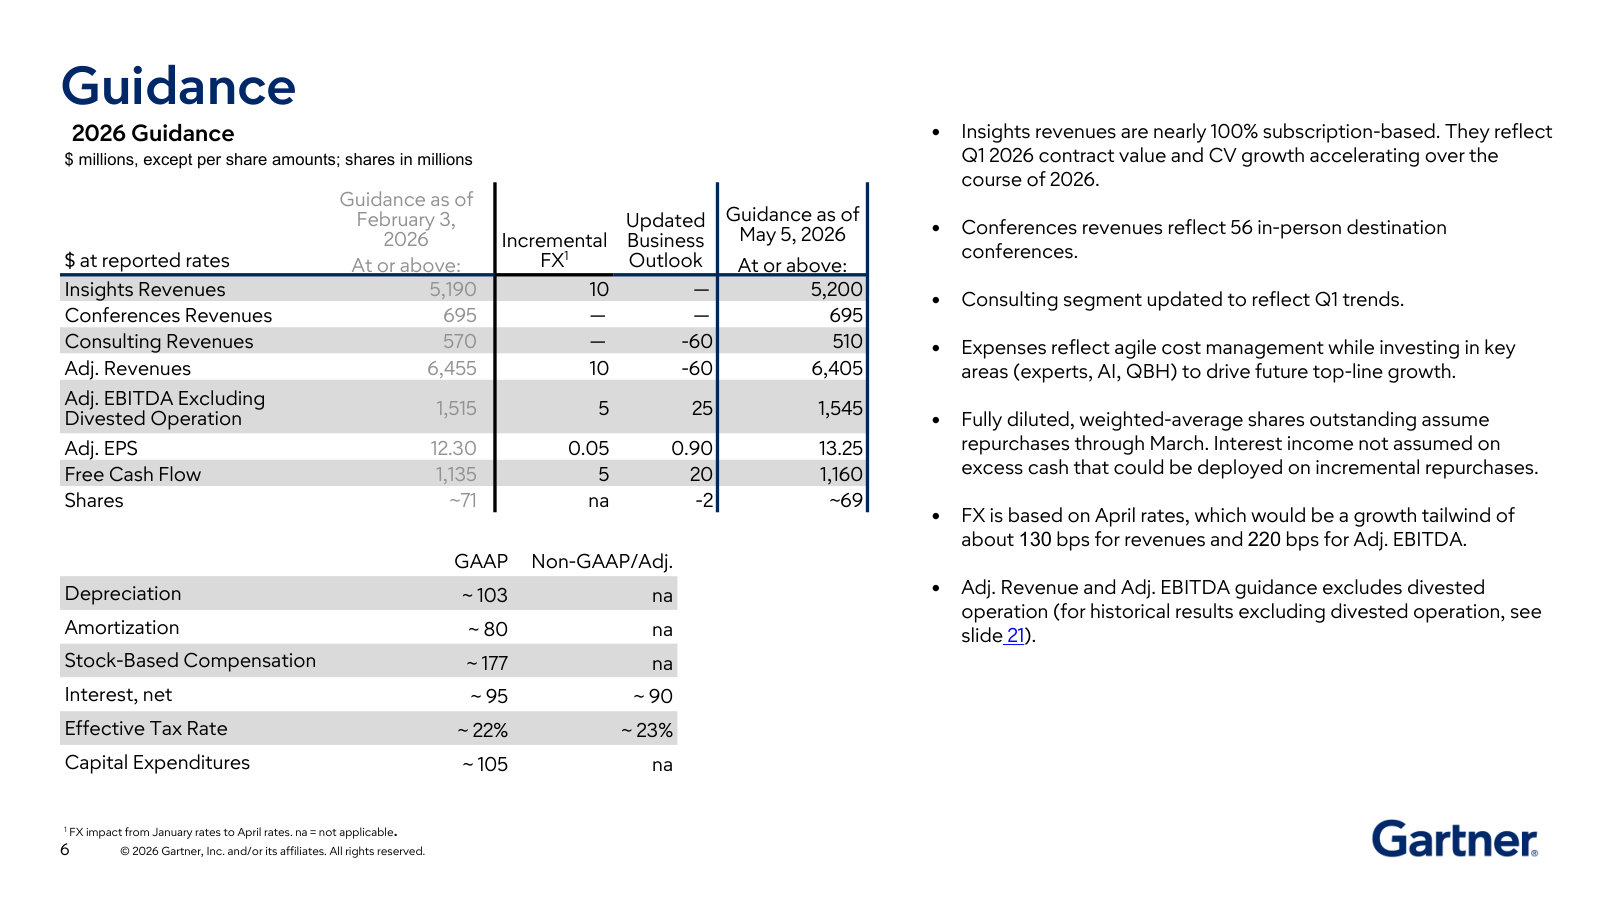
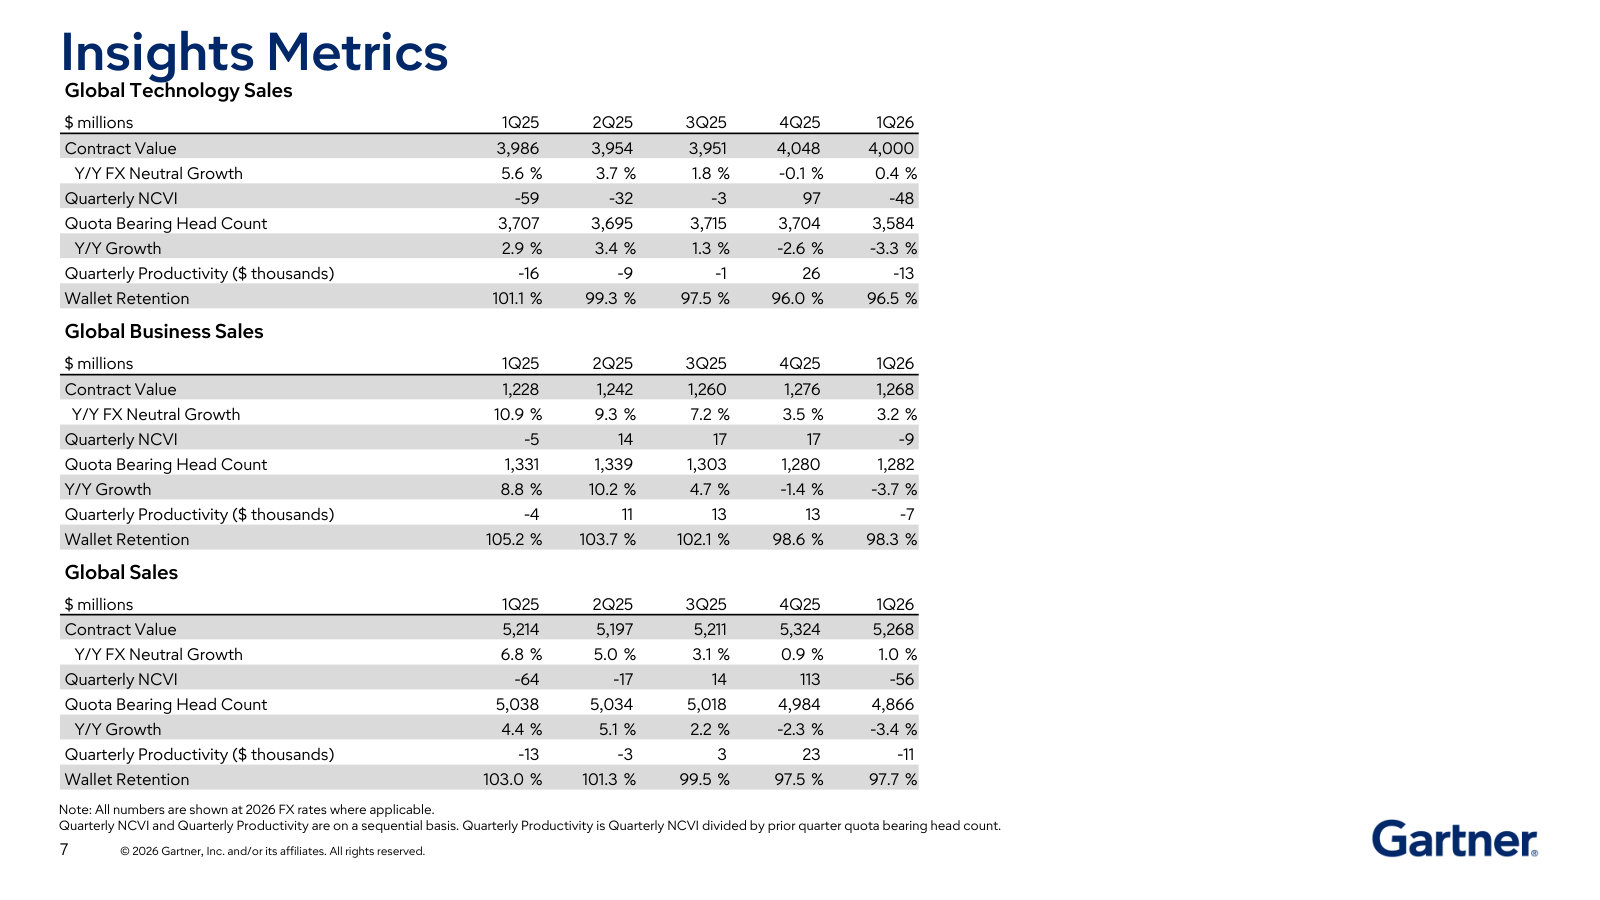
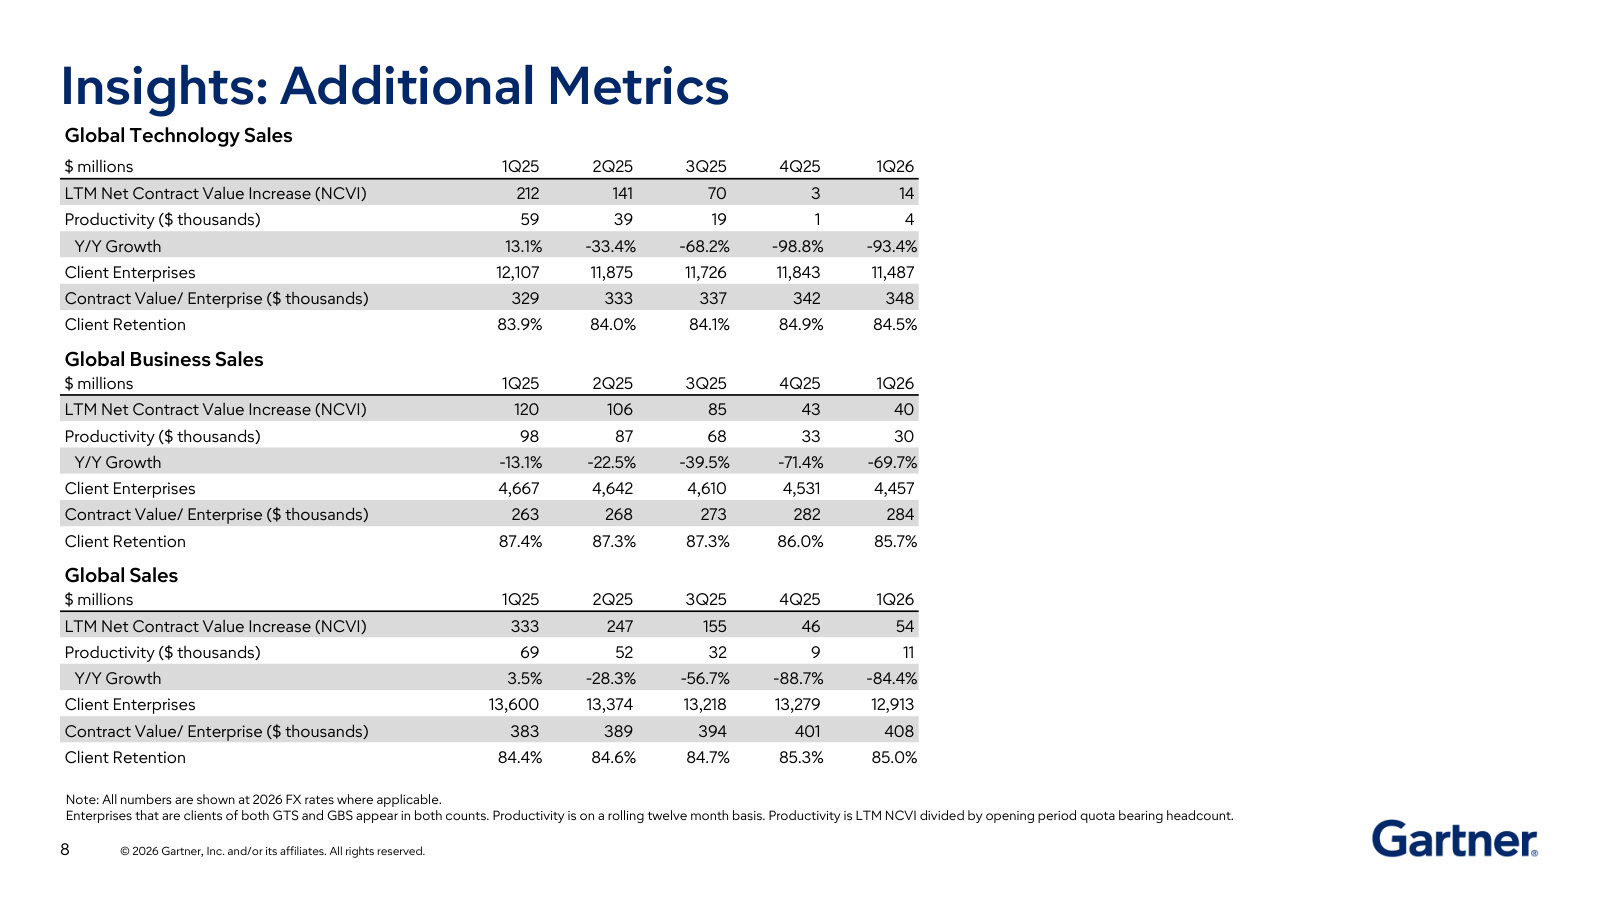
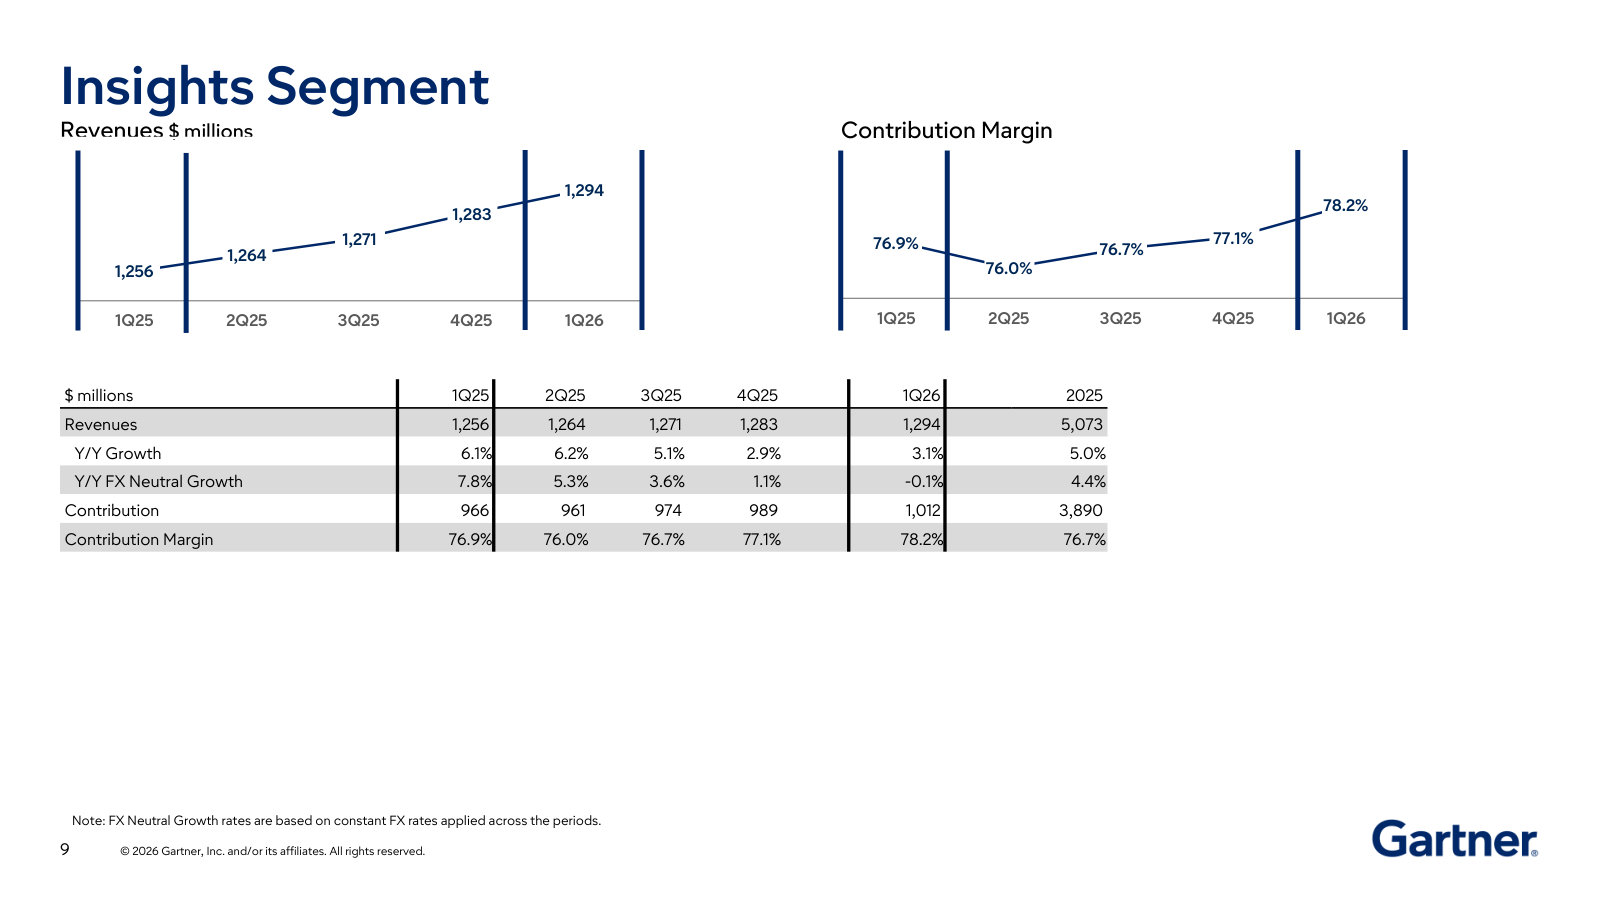
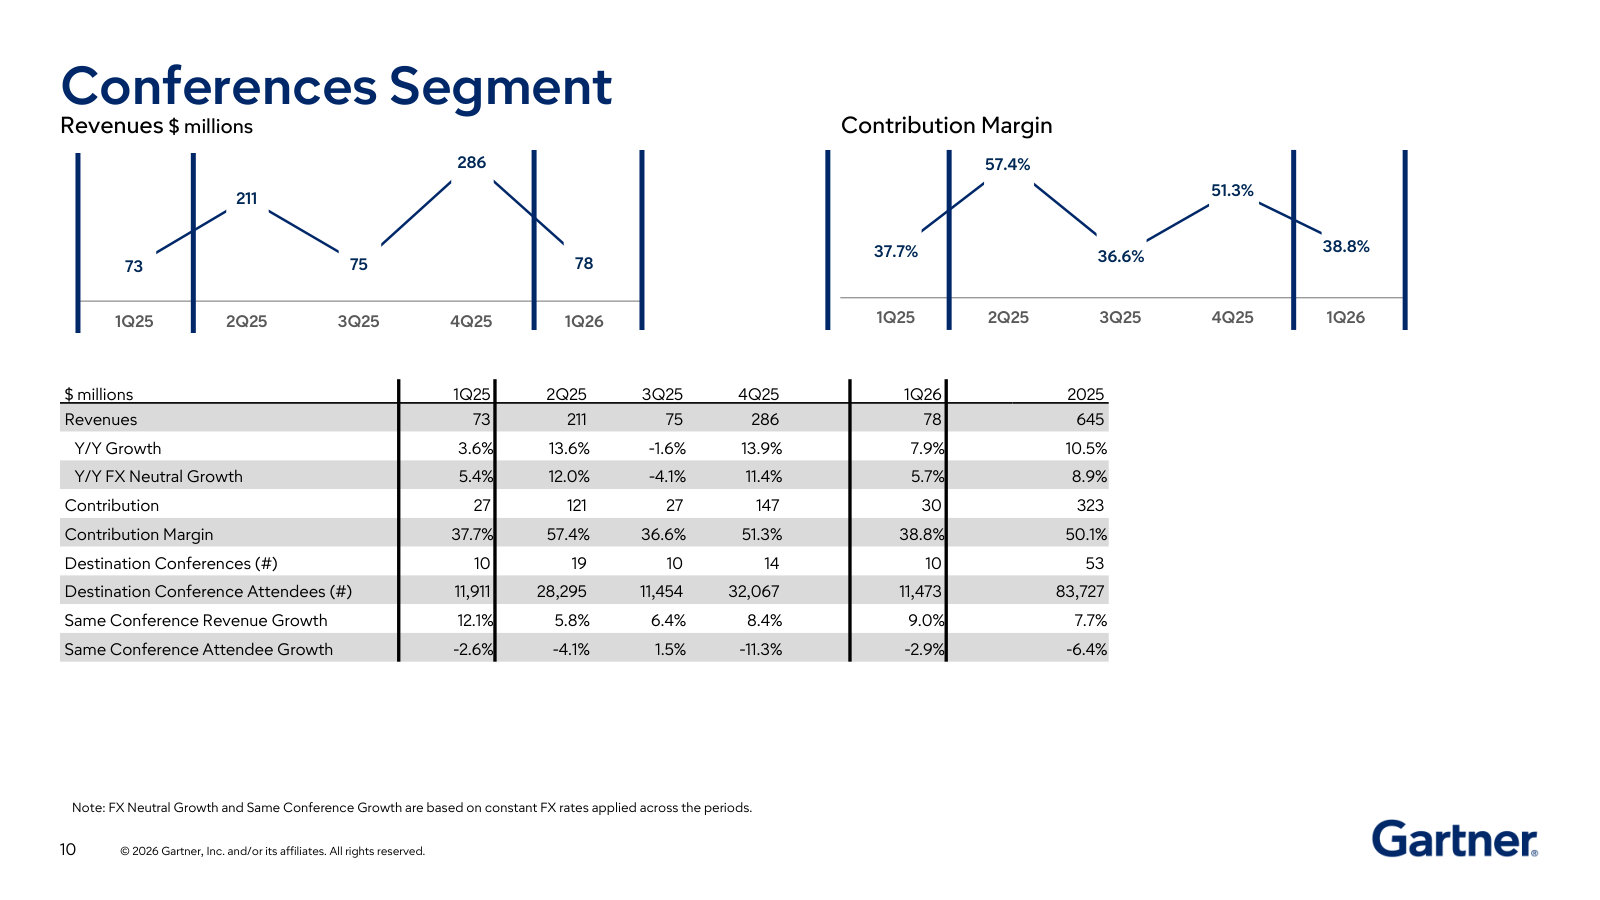
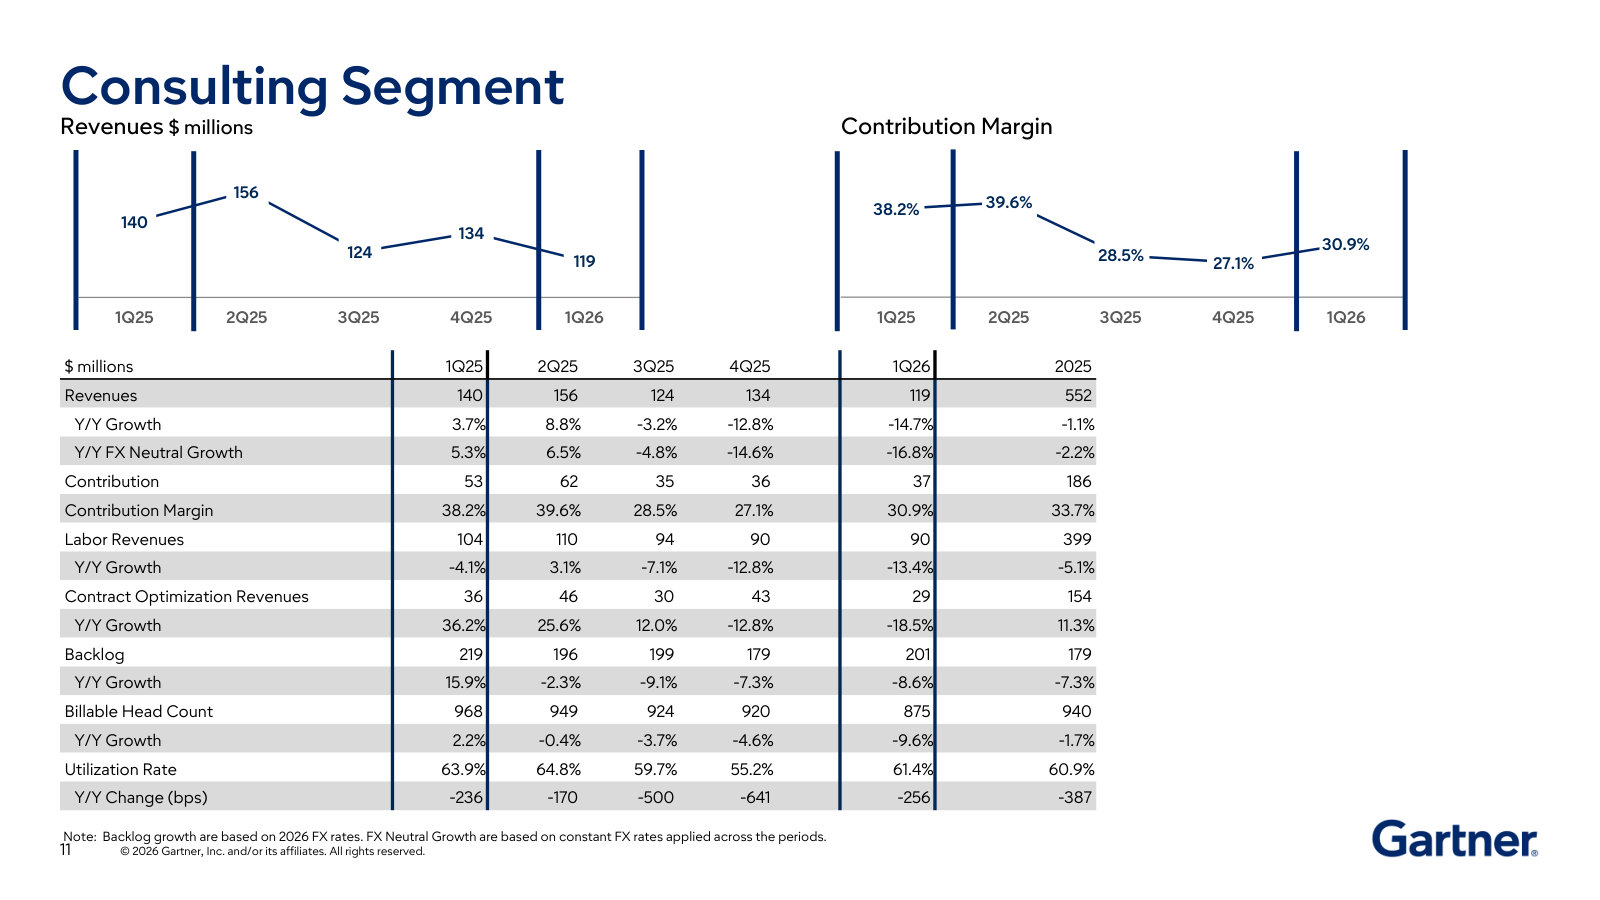
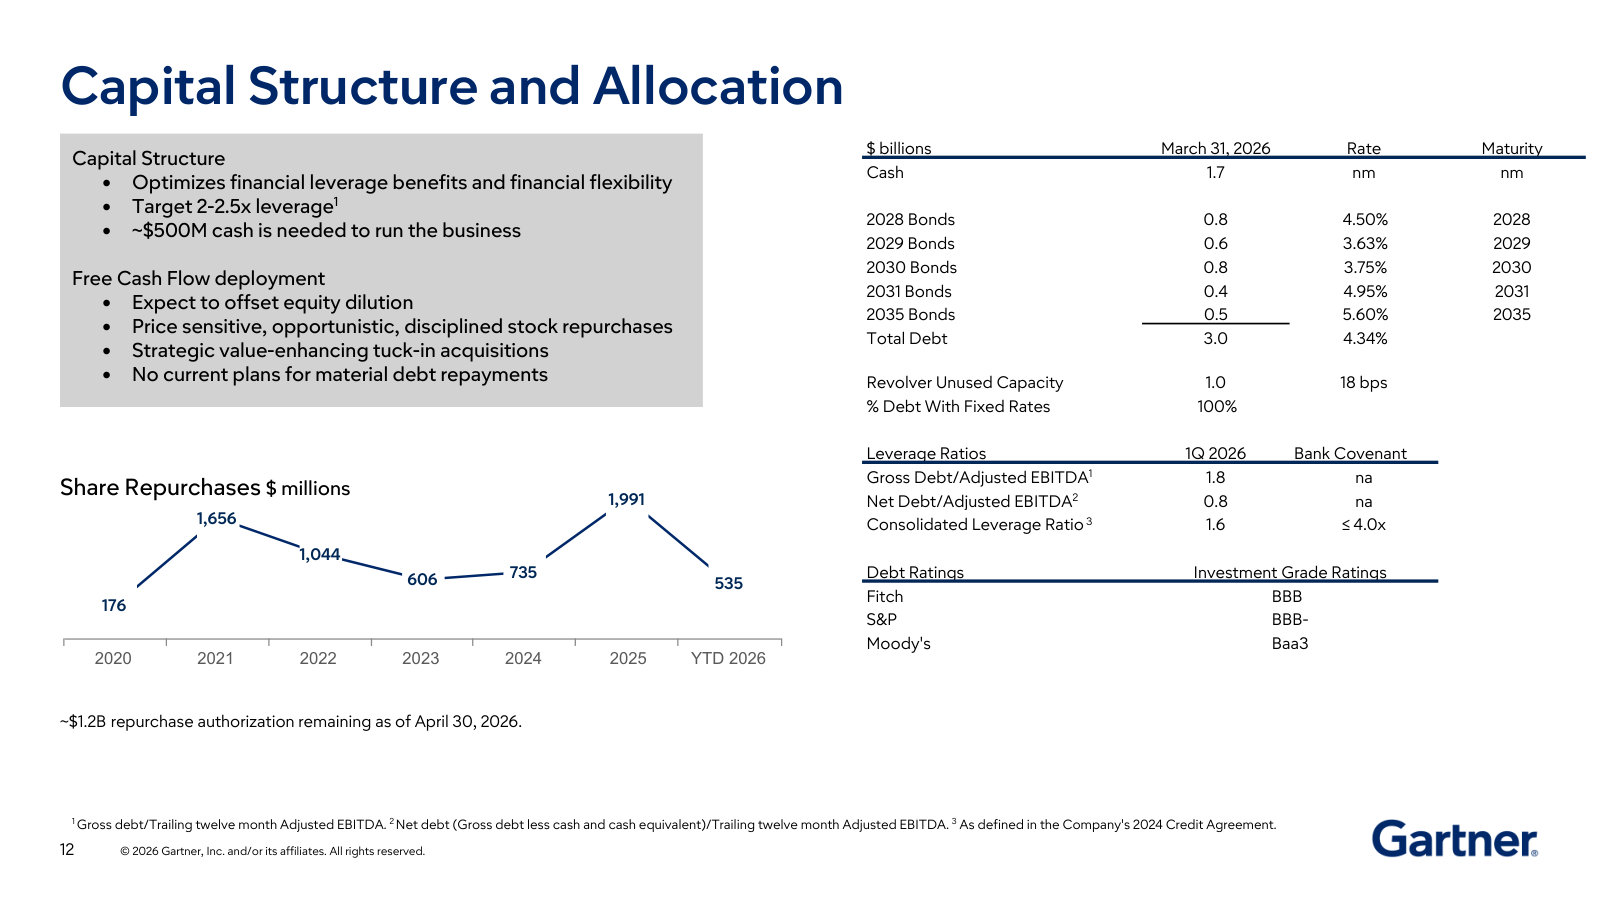
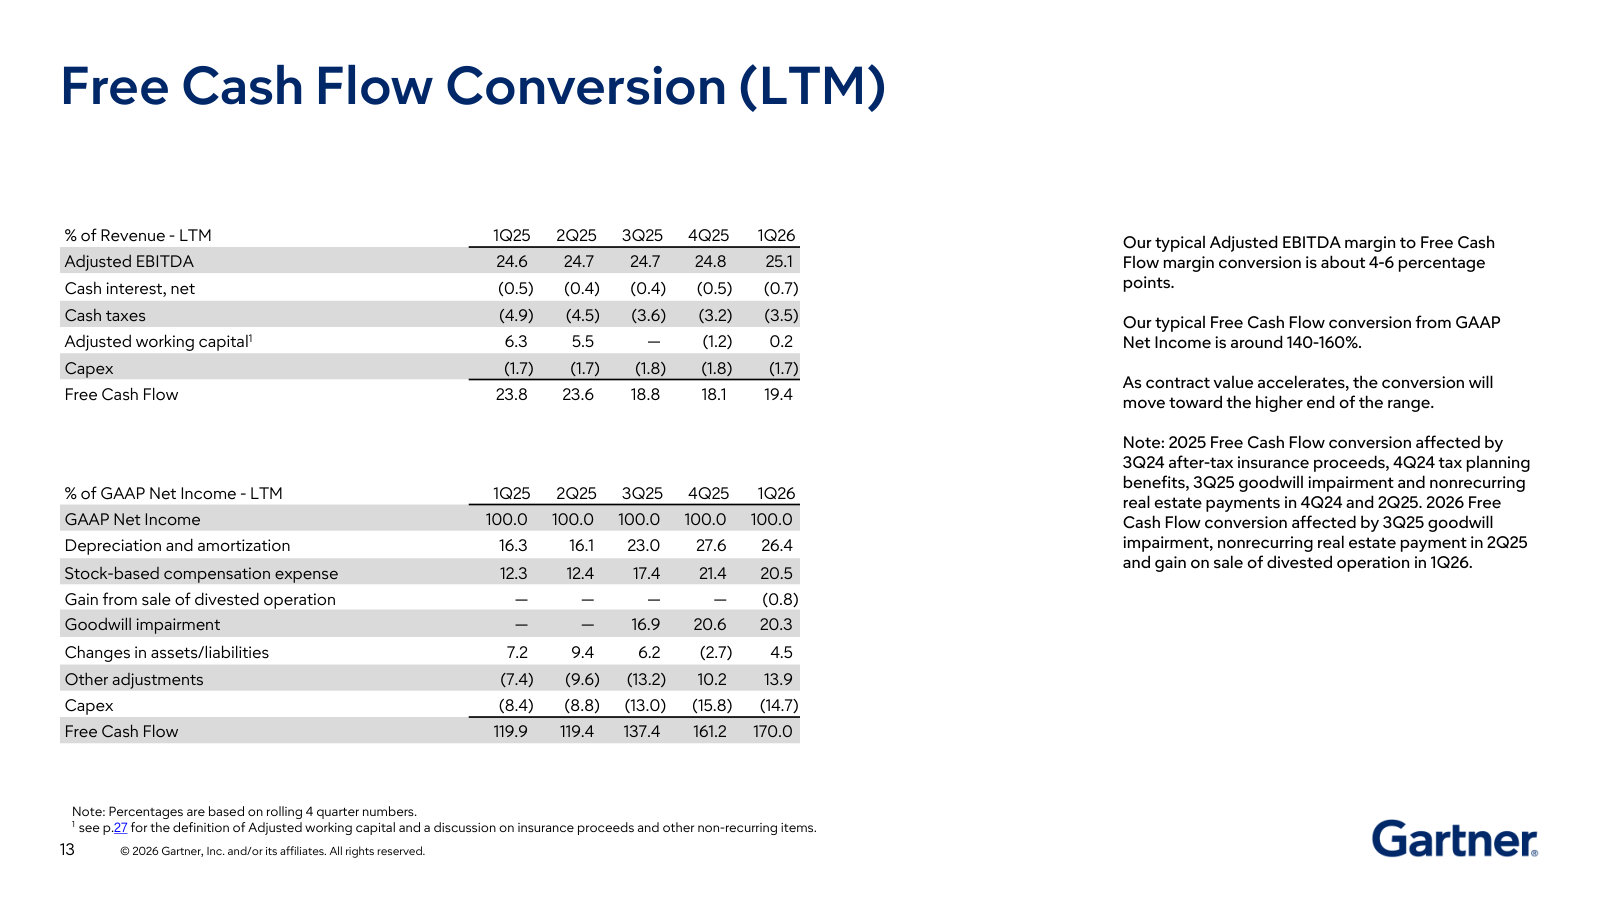
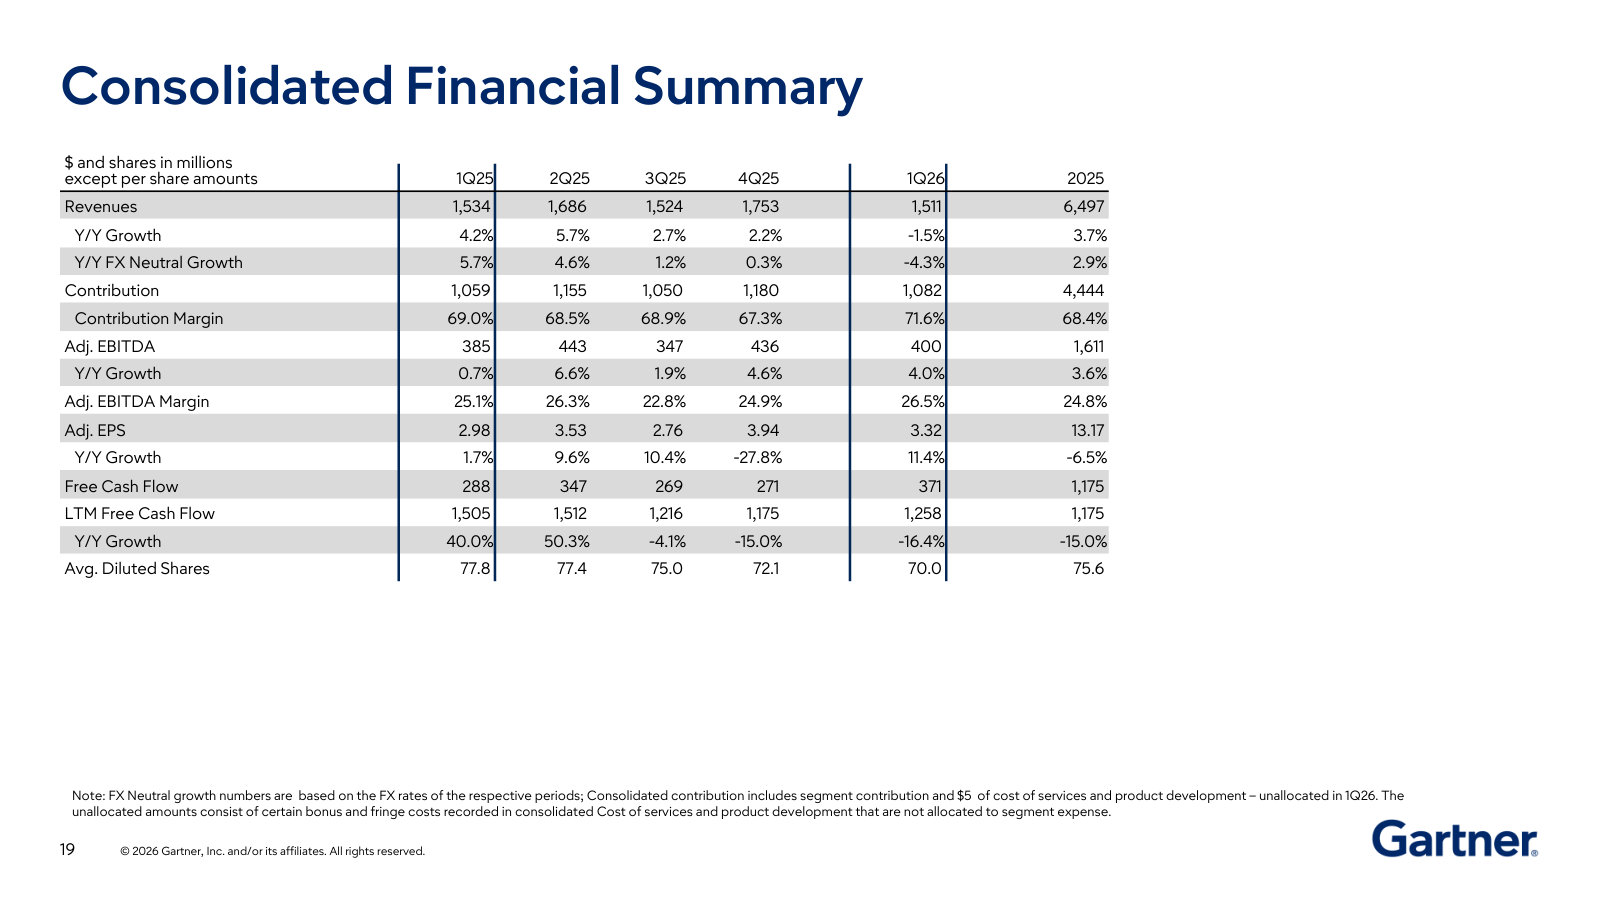
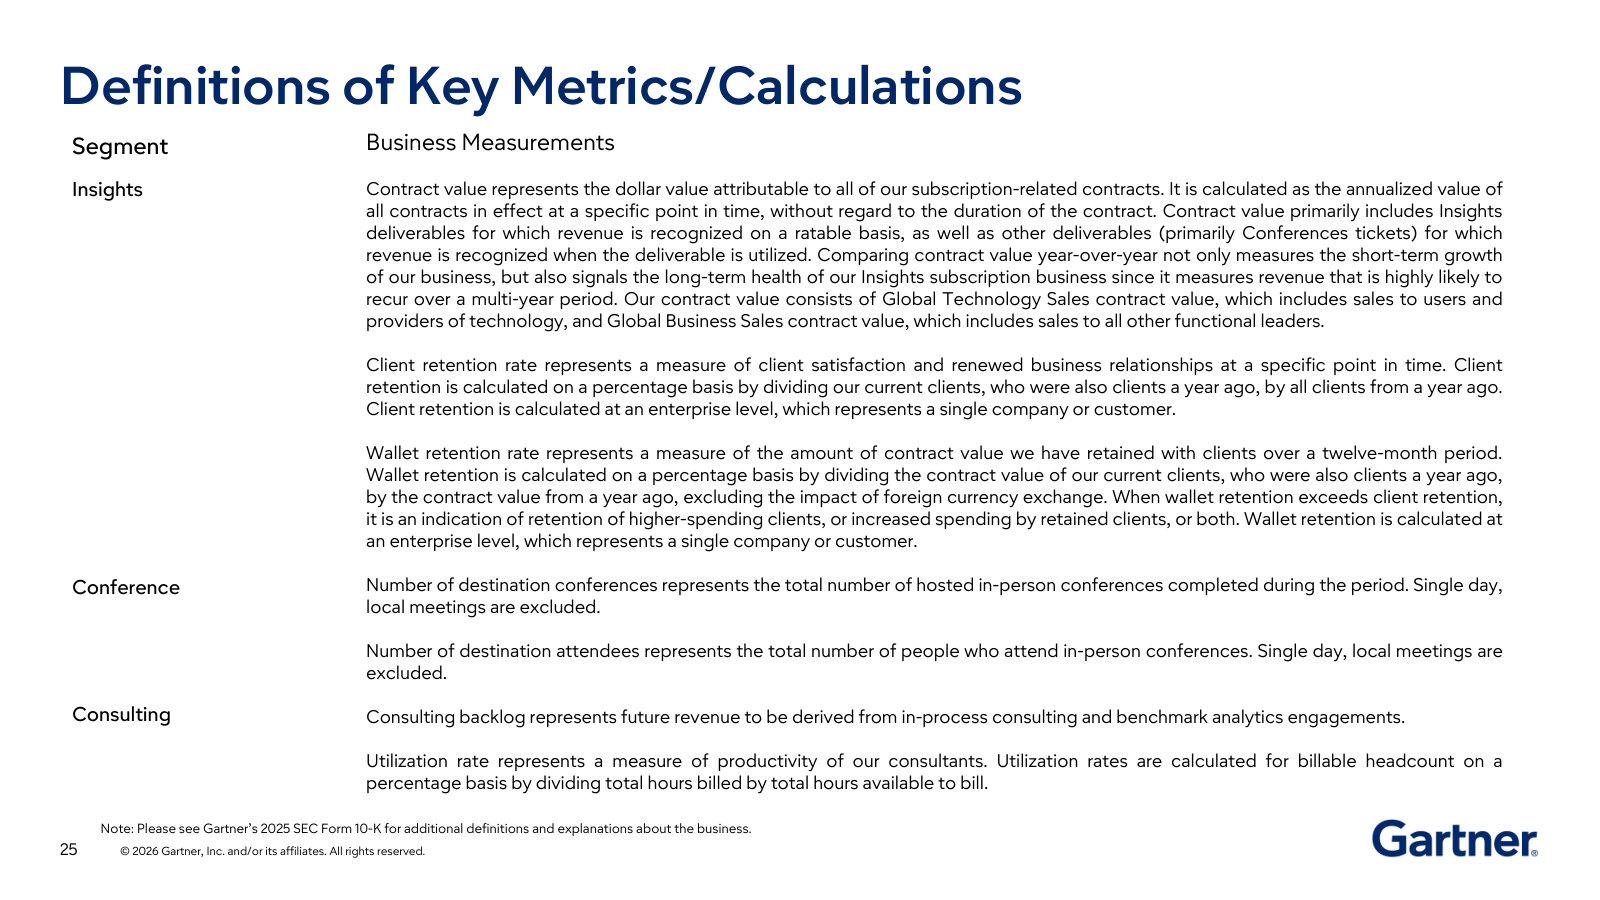
p. 4 — The business in one diagram: the client-value flywheel — objective insight, analyst access, conferences and tools sold to C-level executives. · Open the full presentation →p. 5 — The scoreboard for the whole model: contract value, the three segments, contribution margins, EBITDA and free cash flow on one page. · Open the full presentation →p. 6 — 2026 guidance with the commentary that explains the model — Insights is ~100% subscription, Conferences is 56 in-person events. · Open the full presentation →p. 7 — The Insights sales engine: contract value, quota-bearing headcount and wallet retention, split into Technology and Business sales. · Open the full presentation →p. 8 — The other half of Insights KPIs — client-enterprise counts, contract value per enterprise and client retention rates. · Open the full presentation →p. 9 — Insights segment: the subscription-research core, ~78% contribution margin and roughly $5.1B of 2025 revenue. · Open the full presentation →p. 10 — Conferences segment: destination-event revenue and attendee counts — lumpy by quarter, ~50% contribution margin over the year. · Open the full presentation →p. 11 — Consulting segment: labor and contract-optimization revenue, backlog, billable headcount and utilization — the smallest, most cyclical unit. · Open the full presentation →p. 12 — Capital structure and allocation: the debt ladder, investment-grade ratings, leverage targets and the buyback-led use of free cash flow. · Open the full presentation →p. 13 — How earnings turn into cash: Adjusted EBITDA and GAAP net income bridged to free cash flow, with the conversion rules explained. · Open the full presentation →p. 19 — Five-quarter and full-year 2025 consolidated summary — revenue, margins, Adjusted EPS, free cash flow and share count in one table. · Open the full presentation →p. 25 — Definitions that make the deck readable: what contract value, wallet vs. client retention and consultant utilization actually measure. · Open the full presentation →
Fourth Quarter 2025 Results (Earnings Supplement) — Q4 / FY2025 · 33 pages · The full-year 2025 supplement and the original 2026 guidance the Q1 deck later updated; same layout as the featured deck. · Open →