Full Report
Fit — Gartner, Inc. (IT)
Does not fit the framework (P1 not met)
Gartner does not fit the framework. The year-10 durability gate (P1) is not met — four jurors across two model families voted not_met with a trimmed-mean p_year10 of 0.60 and a spread of 0.05 — and under the framework's rules that gate forces the verdict on its own; nothing offsets it. Confidence is high: two model families agreed, the trial was order-stable, and load-bearing spreads were at most 0.15. No exclusion was triggered, the watchlist_only flag is off, and the name-mask probe raised no prior-driven-risk flag.
Universe and exclusions — unsoftened
Gartner clears both universe lines. It is a Delaware-incorporated company whose common stock is listed on the New York Stock Exchange under the symbol IT [1], a primary US listing (U1 met, unanimous). USD market capitalization computes to $10.599B (75,605,000 shares × $140.19 close on 2026-07-17), above the $10B scale line (U2 met, unanimous) — but the cushion is only about $0.60B (~6%), and it rests on a stock that has fallen 74.6% from its 2024 peak, so a further modest leg down would put the name out of universe.
No exclusion was hit. X1 (auto OEM) — Gartner is a research and advisory firm selling Insights, Conferences, and Consulting to 13,000+ enterprises, with zero vehicle-manufacturing revenue [2]; not a hit. X4 (consensus-saturated story) — the stock trades at ~1.6x sales and ~10x forward EPS after a 74.6% de-rating on a majority-hold sell side (3 buy / 9–10 hold), the antithesis of the extreme-multiple euphoria X4 tests for; not a hit. X2 (promotion pattern) and X3 (structural decline) are evidential and are treated in the pillar ledger below; both resolved not_met. S1 (China dependence) is a sensitivity flag only and was not raised: China is not separately disclosed, and any China exposure sits inside an "Other International" line that is 11.9% of revenue and spans all of Asia-Pacific and Latin America [3].
Note the four exclusions (X1, X2, X3, X4) show a label split — three jurors recorded not_met and one recorded not_hit — but that is wording, not a factual dispute: every juror found the exclusion did not apply.
Pattern match
On surface features this is the shape of an event-driven dislocation with a high-yield entry: a dated adverse catalyst (two guidance-day crashes), a ~77% peak-to-trough drawdown, an adjusted FCF yield sitting within a rounding error of the balance-sheet bar, and an earnings numerator that held while the multiple collapsed. That is the closest resemblance among the framework's constructive setups.
It fits none of the four patterns as a qualifying entry, because the setup fails on the pattern's own core checks rather than its surface. The year-10 durability gate is not met; the temporary-vs-permanent diagnosis (P5) came back leaning permanent (p_temporary 0.38); and the adjusted yield is below its bar today. A qualifying dislocation requires the impairment to be diagnosed as temporary with the franchise intact for a decade — here both of those load-bearing checks fail, so the resemblance does not convert into a fit. This is framing only; it does not alter the tally's verdict.
The pillar ledger
Source: deterministic fit tally (per-criterion aggregate verdicts, trimmed-mean probabilities, and spreads).
Year-10 durability (P1) — the gate that decides it
Not met (unanimous, both families; p_year10 0.60, spread 0.05). The revenue disqualifier is false: FY2025 revenue grew 3.7% to $6,497.2M with no consecutive-decline years, off a model that is asset-light, high-margin, and customer-funded — 78% of revenue is 77%-gross-margin Insights subscriptions that clients prepay, with contract liabilities of $2,841.6M and capex only 1.8% of revenue [4]. What puts the year-10 leg in genuine doubt is that the forward engine has stalled: total Insights contract value grew only ~1% FX-neutral, GTS contract value was flat ($3,910M vs $3,911M), and wallet retention fell below the 100% net-expansion line for the first time in the window — GTS 96% (from 102%), GBS 99% (from 106%) [5]. The 10-K itself concedes "Limited barriers to entry exist in the markets in which we do business" [6] and newly names LLMs that "could reduce the need to enter our websites" [7]. Operating margin compressed from 20.9% (FY2023) to 15.8% (FY2025) on flat contract value and a $150M Digital Markets goodwill impairment [8].
Strongest surviving counter-fact: Gartner is winning the peer race decisively — FY2025 revenue +3.7% at 15.8% operating margin against the closest pure-play, Forrester, at −8.2% and a −28.5% operating margin [9] — and part of the FY2025 retention hit is an isolable US-federal/DOGE one-off (Insights federal CV ~$126M, less than half retained), with ex-federal CV still growing ~3.5% in Q1 FY2026. That is why the temporary-vs-permanent diagnosis is genuinely two-sided rather than settled against durability — but the gate resolves on genuine doubt, and the doubt is present. Full treatment: The Engine Stalled and The Cash Machine.
FCF consistency (P2)
Met (unanimous). Hand-computed adjusted FCF (operating cash flow − capex − SBC − trailing five-year average acquisitions) held a tight band across FY2021–FY2025: a ~$1,034M five-year average, coefficient of variation ~12.4%, no negative years, and a max/min of only 1.37x [10]. The deterministic fcf_stability feature was not_computable (the cash-flow feed lacked capex/SBC/acquisitions), so every figure was rebuilt from the primary cash-flow statements in the FY2021 [11] and FY2022 [12] 10-Ks.
Strongest surviving counter-fact: the low-volatility record is a modern-regime phenomenon roughly five years long, not a full cycle — stretching the window to FY2019–FY2025 raises the CV to ~31%, because FY2019 adjusted FCF was only ~$321M in the CEB-integration era [13]. Full treatment: The Cash Machine.
Dislocation + yield (P3)
P3a identifiable event — met (unanimous). Two dated adverse events anchor the fall. On Aug 5, 2025 Gartner cut full-year guidance and named US-federal/DOGE weakness as the largest headwind; the stock fell 27.6% in one session on ~4.5M shares [14]. On Feb 3, 2026 the Q4 print introduced a weak 2026 guide against a "challenging selling environment" and the stock fell 20.9% on 7.31M shares — the single highest-volume day of the entire fall [15].
Strongest surviving counter-fact: the cuts reflected real deceleration — Q2 CV growth of only 5% and wallet retention below the net-expansion line [16] — and roughly half of the peak-to-trough loss came as event-free drift before Aug 5, so the setup is a hybrid (a slow multiple derating plus two fear-driven guidance legs), not a clean single-trigger dislocation.
P3b capitulation — met (unanimous; reference line, not a gate). Traded volume during the fall reached 7.17x the trailing median, far above the 2x reference line, centered on the two guidance-day crashes. The only caveat: heavy volume characterizes the event legs, not the ~50% of the decline that came as lower-volume drift.
P3c yield vs bar — not met (unanimous). Net-debt/EBITDA of ~1.0x classifies the balance sheet as moderate, setting the bar at 10% (the deterministic feature returned "unknown" because EBITDA was missing, so this was hand-classified). Current adjusted FCF yield computes to 9.61%, about 39 bps below the 10% bar; the three-year-average adjusted yield reaches 9.96%, ~4 bps short [17]. Strongest surviving counter-fact: the yield is high only because market cap fell ~77% (from ~$45B at the peak, ~2.7% yield) to $10.6B; FCF itself fell 15% in FY2025, so the yield "jumped toward the bar" via price, not via growing distributable cash.
P3d forward path — met (unanimous; p_forward_bar 0.62, spread 0.01). Consensus puts unadjusted FCF yield at 11.3–12.6% through FY2028 and adjusted yield crossing 10% by FY2028, so the underwrite is consensus-backed [18]. Strongest surviving counter-fact: consensus assumes FCF essentially flat FY2025–FY2027 with the decisive step-up deferred to FY2028, the last year before coverage drops out — and the most recent actual FCF fell 15%, so the flat-or-better path is already under pressure. Full treatment: Priced For Impairment.
Balance sheet + self-help (P4)
P4a outlast + allocation — met (unanimous). All $3,005.0M of debt is unsecured senior notes laddered 2028–2035 with no maturity before the $800M 2028 notes, the $1.0B revolver is fully undrawn, and net leverage is under ~2x, so debt service does not compete with repurchases [19] [20]. Strongest surviving counter-fact: the direction of pressure is the opposite of the criterion's fear — FY2025 buybacks of $1,991.1M exceeded operating cash flow of $1,290.4M and were part-funded by $799.9M of new 2031/2035 notes, lifting net debt from $526.8M to ~$1.26B and thinning equity to $319.9M [21].
P4b repurchase engine — met (unanimous). Executed cash buybacks totaling ~$6.03B over FY2021–FY2025 drove diluted shares down 16.0% (90.017M → 75.605M), with a record $1,991.1M in FY2025 and $535M more in Q1 FY2026; repurchases outrun SBC issuance roughly 10x, and the feature flags share_count_trend.rising = false [22] [23]. Strongest surviving counter-fact: the record FY2025 repurchase was debt-funded and executed into a falling knife — Q4-2025 open-market buys averaged $239.06/share against a ~$140 price by mid-2026 — so per-share value creation depends on whether the ~75% drawdown was mispricing or a rerating.
P4c dividend cover — not applicable (unanimous). Gartner pays no dividend; the return case runs entirely through buybacks [24]. Full treatment: The Buyback Bet.
Diagnosis (P5)
Not met (unanimous; p_temporary 0.38, spread 0.08, trial-carried). The probability that the impairment is temporary was produced by an adversarial trial — two opposing cited briefs, three independent judges — which returned a mean p_temporary of 0.393 and a tally value of 0.38, with contested = false. The earnings numerator held: adjusted operating income was roughly flat (FY2025 $1,025.7M reported + $150.0M goodwill impairment = $1,175.7M, vs FY2024 $1,156.3M), and operating cash flow fell only ~13% even as reported net income fell 42% to $729.2M on one-off distortions [25]. But a DCF-lite on FY2025 FCF of $1,175.2M at a 10% discount rate shows the market already capitalizes a near-permanent diagnosis: price (~$139 no-growth NPV) sits at the no-growth value and only ~$30/share above the permanent-erosion case (~$110), against a temporary NPV of ~$212 [26].
Strongest surviving counter-fact: the operating driver that broke is contract-value growth, which decelerated 16/12/8/8/1% over five straight years while wallet retention fell below 100% in both salesforces — broader than the isolable federal book and consistent with structural pressure, not a removable one-off [27]. Full treatment: Priced For Impairment.
Instrument context (I1)
Not verifiable (unanimous; facts only, never blocks a pillar). Gartner is an S and P 500 large-cap with an active listed-options market and a dated implied-volatility term structure (30-day IV ~65.8%, 180-day IV ~56.9% as of 2026-07-29, put-call open-interest ratio 0.595, per AlphaQuery), corroborated by run-dated realized 30-day volatility of ~53%. The 30-day IV sits in the elevated 60–70 reference band. The criterion is not_verifiable because the exact long-dated LEAPS expiration list and per-contract open interest/spreads could not be directly read — Barchart, Market Chameleon, OptionCharts, and Nasdaq option-chain pages all bot-walled — so LEAPS existence is inferred from large-cap status plus the observed IV term structure, not a directly read 2027/2028 chain. Full treatment: Priced For Impairment.
What a 3x-in-3-years would require
The tally records: "Re-rating math unavailable because the applicable bar or normalized adjusted FCF is missing." The bar, normalized_adjusted_fcf, implied_market_cap_at_bar, and upside_to_bar_pct fields are all null, because the deterministic adjusted-FCF-yield feature was not_computable (no annual FCF/capex/SBC series; EBITDA missing for FY2025). The framework's price-at-bar-yield test therefore cannot be rendered from a canonical feature.
The closest available arithmetic is the DCF-lite the Damage Math pillar carried (FY2025 FCF $1,175.2M, 10% discount rate):
Source: derived from reported financials (FY2025 Consolidated Statements of Cash Flows) [28].
A 3x in three years from $140.19 implies roughly $421/share. Even the temporary-diagnosis NPV (~$212, ~1.5x, near the sell-side high of ~$203) falls well short of that, and the permanent case (~$110) is below today's price. On the modeled paths the framework's 3x target is not reached on any scenario — it would require FCF to compound materially faster than the temporary case assumes and consensus to concede a full re-acceleration of contract value to double digits. For base-rate context on how deep this drawdown is and how such episodes have recovered, see Priced For Impairment. This is the framework's target test stated as arithmetic, not a recommendation.
Contested and undetermined
Nothing was marked contested; the flags list is empty. The one criterion that could have been contested — the P5 diagnosis — was pressed by the adversarial trial and returned contested = false (three judges at p_temporary 0.36 / 0.38 / 0.44; order-stability gap 0.05), landing at 0.38.
Nothing resolved to cannot-determine, so there is no named missing datapoint that flipped a verdict. One criterion, I1 (instrument context), is not_verifiable — options existence and IV term structure are established from a dated source, but a directly read far-dated option chain could not be pulled (vendor bot-walls); I1 never blocks a pillar and only drives the watchlist overlay, which is off here.
Provenance
| Field | Value |
|---|---|
| Jury seats | a = claude, b = claude, c = codex, d = codex; masked = claude |
| Model families | claude, codex |
| Gate agreement | P1 unanimous not_met across both families (spread 0.05) |
| Load-bearing spreads | ≤ 0.15 (P1 0.05; P3d 0.01; P5 0.08) |
| Trial order-stability | temporary-first mean 0.36; permanent-first mean 0.41; gap 0.05 |
| Name-mask probe | max probability gap 0.02; no gate criteria flipped → prior_driven_risk = false |
| Skeptics | 38 claims triaged; 17 adversarially pressed → 14 survived, 2 weakened, 0 refuted, 1 unverifiable, 21 triaged-only |
Source: deterministic fit tally (provenance block) and the adversarial trial tally.
The verdict was pressed reasonably hard and held: two independent model families reached the same gate call without the tie-breaking help of any single juror, and re-ordering the trial's reading sequence moved the diagnosis probability by only 0.05. The name-mask probe — re-running the jury with the company's identity hidden — changed no gate verdict and moved probabilities by at most 0.02, so the call is driven by the evidence, not by a prior about the name.
The falsifier ledger
These are the standing what-would-change-this conditions carried in the tally. The first five are the framework's generic templates (each a direction on a level already underwritten); the remainder are Gartner-specific, most embedding their own threshold and window (a fiscal-quarter deadline, a contract-value or retention level, a margin floor). Conditions explicitly tagged "Toward temporary" / "Toward permanent" state the direction they would push the diagnosis.
Data gaps
What the run could not answer, from the tally's list:
- China exposure is not measurable. China revenue and assets are not separately disclosed in the FY2025 10-K; geography is reported only as US and Canada / EMEA / Other International, so any China dependence can be bounded (below the 11.9% "Other International" line covering all Asia-Pacific plus Latin America) but not measured.
- The cyclical-vs-structural crux is not resolvable from disclosures. Whether the contract-value/wallet-retention stall is cyclical (US federal/DOGE plus budget pullback) or structural (AI/LLM disintermediation) cannot be settled from filings — no price/volume or churn-reason cohort split is disclosed. This is the P1/P5 crux and was carried into the trial, not settled in the pillars.
- Adjusted-FCF features are not_computable.
features.adjusted_fcf,adjusted_fcf_yield,fcf_stability, andbalance_sheet_classall returned not_computable (no annual FCF/capex/SBC series; EBITDA missing for FY2025), so the year-10 adjusted-FCF leg, the yield-vs-bar test, and the balance-sheet class all rest on figures rebuilt by hand from the primary cash-flow statements rather than canonical features. - No matched before/after consensus across the first, largest leg of the drawdown. The estimates-momentum feed only reaches back 180 days (to 2026-01-29), so the estimate path over the Nov-2024 peak to early-2026 leg — where most of the ~74.6% decline occurred — is not in the data; the peak-to-current damage is measured on price, not on a matched consensus revision.
yield_baseline.per_yearis empty, so the fortress "stable-yield-that-suddenly-jumped-to-the-bar" capitulation signature cannot be corroborated from the features file.- Instrument granularity. The exact long-dated LEAPS expiration list and per-contract open interest / bid-ask spreads could not be directly observed (vendor option-chain pages bot-walled); options existence and IV term structure are established from a dated source plus large-cap status, but a directly read far-dated chain is unavailable.
- Covenant cushion is inferred, not measured. The exact maximum-leverage-ratio threshold in the 2024 Credit Agreement is not disclosed on the read pages, so covenant headroom is inferred from the wide margin (net leverage under ~2x), not measured to the limit.
- Insider-selling window is short. The Form-4 feed only spans 2025-10-01 to 2026-07-01, so a longer-run view of CEO Hall's 10b5-1 selling cadence for the X2 insider prong could not be sourced; within the window there was no Hall open-market selling.
Checked and unremarkable
All eight synthesis scouts returned load_bearing — none was routine or empty — so their findings feed the pillars above rather than this list: accounting/cash-quality, business-economics, capital-allocation, competition-moat, history/track-record, industry, people/governance, and valuation-expectations.
Playbook version
Playbook fcf-dislocation, version 4 (spec playbook/fit-spec, version 2), as frozen for this run.
The Cash Machine
Gartner, Inc. reported $6.50 billion of revenue in 2025 across three business segments [1]. Read the segment table one line down, though, and the company nearly collapses into a single product. One segment — Insights — is $5.07 billion of that total, 78% of revenue and roughly 88% of the profit the segments generate. Conferences and Consulting, the two lines most outsiders picture when they hear "Gartner," together contribute about a tenth of the group's gross profit. To understand this company is to understand one recurring subscription, how it converts to cash faster than it earns, and the two dials that move it. Everything else is an adjacency.
This chapter builds that mental model — what the machine sells, how it turns, and why it is in front of an investor now, with its compounding rate cut from mid-teens to low-single-digits and its stock down roughly three-quarters from its peak. The acts that follow diagnose the slowdown, weigh what management said against what it did, examine the record buyback, and take up how the market prices the whole picture.
One subscription runs the company
Gartner sells syndicated research: independent, objective analysis of technology and business questions, written once and licensed to many enterprises by subscription. The Insights segment delivers it as on-demand access to published content, data and benchmarks, plus direct access to a network of more than 2,400 Gartner experts [2]. A CIO deciding on a cloud vendor, an HR chief benchmarking pay, a supply-chain head vetting software — each buys a seat and renews it annually. Because the underlying research is produced once and sold repeatedly, each incremental subscription drops a large share of its price to gross profit.
The company measures each segment not on revenue but on gross contribution — operating income before the shared corporate costs of selling, depreciation and amortization — because that is where the economics diverge sharply [3]. Insights earns a 77% gross-contribution margin [4]. Conferences — the trade shows and Symposium events — earns 50%; Consulting, a people-heavy advisory business billed by the hour, earns 34% [5]. Set against gross contribution, the shape of the business is plain.
Source: FY2025 Annual Report (Form 10-K), Segment Results [6]; [7].
Insights generates $3.89 billion of gross contribution; the other two segments combined generate about $0.51 billion. Conferences and Consulting exist largely because they feed and deepen the subscription — a Symposium keynote and a consulting engagement are on-ramps to a renewal — but they do not, on their own, move the group's profit. The rest of this report treats "Gartner" and "the Insights subscription" as very nearly the same thing, because financially they are.
The two dials
If Insights is the engine, two numbers are its throttle and its fuel gauge, and neither is a published price list.
The first is Contract Value — the annualized run-rate of all subscription contracts in force at a point in time. It is the closest thing to a forward-revenue tell this business has, because a contract signed today largely becomes next year's Insights revenue. At the end of 2025, total Contract Value was $5.155 billion, up 1% on a foreign-currency-neutral basis [8]. Gartner splits that book across two salesforces: Global Technology Sales (GTS), selling to buyers and vendors of technology, and Global Business Sales (GBS), selling to every other function — finance, HR, supply chain, marketing.
The second dial is retention, and Gartner reports it two ways that answer two different questions. Client retention asks whether the logo renewed at all; it held near 85% for GTS and 86% for GBS. Wallet retention asks whether the renewing client spent as much or more; it was 96% for GTS and 99% for GBS — both below the 100% line that separates a base that expands on renewal from one that contracts [9]. The distinction matters: clients are staying, but on average paying slightly less to stay.
Source: FY2025 Annual Report (Form 10-K), Insights segment KPIs [10].
Contract Value is not conjured; it is produced by people. The quota-bearing salesforce is the machinery that grows the book, and its headcount is therefore a leading indicator of future Contract Value. In 2025 that machinery shrank: GTS sales associates fell 3% to 3,704 and GBS fell 1% to 1,280, a combined 2% reduction [11]. That is the throttle on the top line. The other lever sits on the operating line, and it is the same salesforce viewed as a cost.
Gartner's gross margin barely moves — it sat between 68% and 70% every year from 2022 through 2025 — because the research is already written. What moves profitability is selling, general and administrative expense, which is dominated by that salesforce. In 2025 SG and A rose 6%, to $3.1 billion, outpacing 4% revenue growth: personnel costs added $150.1 million and workforce-reduction charges another $56.6 million, and a separate $150.0 million goodwill impairment in the Digital Markets unit compounded the pressure [12]. With the gross line fixed, SG and A is the one dial that swings operating margin — and in 2025 it swung it down, from 18.4% to 15.8%.
The mechanism to hold onto is symmetric. Cutting sales heads protects near-term margin but removes the capacity that generates next year's Contract Value; adding them does the reverse. That trade-off — sales cost today against bookings tomorrow — is the operating tension the later acts return to.
Why the cash beats the earnings
The most important thing to understand about Gartner is that it collects money before it does the work. Enterprises prepay their subscriptions, and Gartner recognizes that revenue over the year as it delivers the research. The gap between cash-in and revenue-recognized becomes deferred revenue — a liability that is really a pool of customer money the company already holds.
At the end of 2025 that pool stood at $2.84 billion of total contract liabilities, against fees receivable of $1.69 billion [13]. Customers, in aggregate, fund the business's working capital: it owes its clients more delivered service than its clients owe it in payment. That is the opposite of a company that must finance inventory or receivables to grow, and it is why operating cash flow has historically run ahead of reported earnings — a growing subscription base pulls in tomorrow's cash today.
The other half of the cash story is how little the machine consumes. Gartner spends almost nothing on physical assets: 2025 capital expenditure was $115.1 million, about 1.8% of revenue, and the company made no acquisitions [14]. Operating cash flow of $1,290.4 million less that capex leaves roughly $1,175 million of free cash flow, an 18% free-cash-flow margin [15].
Operating Cash Flow ($M)
Free Cash Flow ($M)
FCF Margin
Capex / Revenue
Source: FY2025 Annual Report (Form 10-K), Consolidated Statements of Cash Flows [16].
There is one wrinkle the reader should carry forward, because it links the cash engine directly to the two dials. The deferred-revenue pool is a tailwind to cash only while it is growing — while more new prepayments arrive than old ones are recognized. When Contract Value expands, the change in deferred revenue adds to operating cash flow; it contributed $169.9 million in 2023 and $181.2 million in 2024. In 2025, with Contract Value flat, it reversed: the change in deferred revenue was a $41.9 million drag [17].
For years, the prepayment tailwind pushed cash conversion above 100% of earnings. That tailwind has just become a headwind — not because the model broke, but because the dial it depends on, Contract Value, stopped growing. The forward book that remains is large: contracts longer than a year hold roughly $6.4 billion of unsatisfied performance obligations, of which $3.9 billion is scheduled to recognize in 2026 [18]. The base is intact; what changed is its rate of growth. And the cash that base throws off does not sit idle — it is returned almost entirely through share buybacks, the mechanics and merits of which are their own act (The Buyback Bet).
Why this is interesting now
Put the pieces together and Gartner is a scaled, cash-generative subscription near-monopoly in syndicated technology research — the kind of business that, for most of the last decade, compounded revenue in the mid-teens on almost no capital. That engine has decelerated sharply. Reported revenue growth ran 15.5%, then 15.7%, then 7.9%, then 6.1%, and 3.7% across 2021 through 2025.
Source: derived from reported financials, FY2021–FY2025 10-Ks; FY2025 consolidated results [19].
At the operating line the compression is real but smaller than the headline suggests: operating margin slipped from about 20.9% in 2023 to 15.8% in 2025, roughly five points, most of it below the gross line in the SG and A and impairment items already described. Reported net income fell 42%, to $729.2 million, but that figure is distorted by non-operating one-timers in each recent year — a 2024 event-cancellation insurance settlement, a 2023 divestiture gain, and the 2025 goodwill impairment — so the earnings optic overstates the operating change [20]. Untangling that is the work of a later act (The Buyback Bet).
What makes the company interesting is the collision between that operating record and its stock. As of mid-July 2026, Gartner's market capitalization was about $10.6 billion, near $140 a share — some 75% below its three-year high. The market has priced a deceleration that, on the reported and guided numbers, looks like an air pocket, as though it were permanent damage. That is the tension this report exists to resolve. Gartner is a cash-gushing subscription-research near-monopoly whose growth engine has decelerated to a crawl — Contract Value flat, wallet retention below 100% for the first time in years — and been re-rated three-quarters off its high as if the impairment were permanent, even though its worst down-moves came on quarters where it beat and estimates rose. What is unresolved, and what the coming chapters take up, is whether that stall is a cyclical air pocket — US-federal spending cuts and a fear of artificial intelligence displacing paid research — or the leading edge of AI structurally disintermediating the product itself, set against a management that reaffirmed its own 12-to-16% growth model five years running and leaned the whole balance sheet into buying back its stock.
The two dials to keep in view are now set. Contract Value tells you whether the engine is refilling; wallet retention tells you whether each client is a bigger or smaller customer than last year. The next act watches them turn.
The Engine Stalled
The two dials that govern the subscription engine — contract value, which tells whether the book is refilling, and wallet retention, which tells whether each client is growing or shrinking — both turned the wrong way in 2025. Total Insights contract value grew 1% on a foreign-exchange-neutral basis, to $5.16 billion, and net wallet retention crossed below 100% for the first time since the pandemic year [1]. The machine did not break. It stopped refilling. What follows separates how much of that is Gartner's problem from how much is the category's.
Total Insights CV growth (FX-neutral)
GTS wallet retention
GBS wallet retention
Ex-federal CV growth (Q1 FY2026)
Sources: FY2025 10-K, segment KPI table [2]; Q1 FY2026 earnings call [3].
Clients Stayed, Spend Shrank
The two dials from The Cash Machine — client retention on logos kept, wallet retention on dollars kept from those same clients [4] — pulled apart in 2025 in the diagnostic direction. Client retention held — 85% in the Global Technology Sales channel and 86% in Global Business Sales, both within a point of the prior year — while wallet retention dropped six to seven points, to 96% for GTS from 102%, and to 99% for GBS from 106% [5]. Enterprises are not walking out the door. They are renewing for less.
That distinction narrows the diagnosis considerably. A wave of departing logos would point to a product losing to a rival; flat logos with shrinking spend points to the expand half of land-and-expand going into reverse — fewer added seats, less new-topic enrichment, thinner upsell — while the installed base stays loyal. It shows up first in the leading gauge. Global Technology Sales contract value, the larger channel and the one selling to both technology users and technology vendors, finished the year at $3.91 billion, effectively flat against $3.91 billion a year earlier; Global Business Sales, selling to finance, HR, supply-chain and legal leaders, grew 3% to $1.25 billion [6]. The technology-facing node is where the flatness concentrates.
The wallet-retention series over time is what gives the moment its shape.
Source: reported segment KPI disclosures across Gartner's FY2019–FY2025 10-Ks; FY2025 and FY2024 figures per the FY2025 filing [7]. Gray line marks the 100% net-expansion threshold.
Two features matter. First, both channels spent the post-2020 recovery well above the 100% line — GBS wallet retention peaked at 115% in 2021, meaning retained clients were spending 15% more each year without a single new logo — and that is the tailwind that had powered mid-teens revenue growth. Second, the only prior dip below 100% was 2020, the pandemic air pocket, which fully reversed the following year. That precedent cuts both ways: it shows a sub-100% reading can be a cyclical trough that snaps back, and it also means 2025 is only the second time in a decade the flywheel has run in reverse. Which of the two 2025 resembles is the question the rest of this chapter, and the acts after it, are built to answer.
One Node, Not One Company
The most useful test of whether a stall is execution or condition is whether an independent competitor, run by different people on a different platform, is describing the same thing in the same words. Forrester — the closest pure-play, roughly one-sixteenth Gartner's size — is. On its Q4 2025 call, Forrester reported contract value down 6% and full-year revenue down 8%, with net retention at 87% [8]. Its CFO attributed the contract-value decline to "low wallet retention, primarily driven by lower enrichment numbers" [9] — enrichment being Forrester's word for the same expansion motion Gartner tracks in wallet retention. Two firms, the same leading metric, the same named cause: shrinking spend per retained client, not client flight.
The softness also has a clear address inside the information-services industry, and it is the syndicated-research node specifically. The FY2025 revenue-growth scoreboard makes the split unambiguous.
Source: reported financials, FY2025 company filings (peer comparison).
The diversified data, ratings and events majors kept growing — Informa up 13.7%, S and P Global up 7.9%, Thomson Reuters up 3.0% — while the research-and-advisory pure-plays shrank: Forrester down 8.2%, Information Services Group down 1.2%, Clarivate down 4.0%. Gartner, up 3.7%, sits at the top of the contracting cohort rather than the bottom of the growing one. A caution on that scoreboard: S and P Global, Thomson Reuters and Informa are adjacencies — ratings, legal-and-tax data, professional events — not head-to-head sellers of syndicated IT research, so they belong in the picture as evidence of where the money is still pooling in information services, not as direct rivals. The genuine like-for-like set is Forrester and ISG, with Clarivate a step further out in scientific and IP data. Read that way, the pattern is not that information services is soft; it is that the subscription IT-research niche that is Gartner's core is soft, and the broader data business around it is not.
That is the load-bearing distinction of this chapter. The headline revenue number — 3.7% growth, decelerating from 15.5% in 2021 — reads like a single company losing momentum. The retention and peer evidence says something more specific: a category-wide contraction in expansion spend, concentrated in the technology-facing node, that two independent operators diagnose identically.
The Leader in a Shrinking Peer Set
Inside that contracting node, the competitive result is lopsided in Gartner's favor, and the numbers make the point without adjectives. Gartner earned a 15.8% operating margin in 2025; Forrester ran an outright operating loss at negative 28.5%, and Information Services Group managed 7.3% [10]. Gartner is the only pure-play in the set still turning a healthy profit while growing, and its wallet retention — even at a diminished 96% to 99% — sits nine to twelve points above Forrester's 87%. When sub-scale competitors slip into losses in the same downturn that costs the leader a few points of expansion, that is scale economics doing what scale economics do.
Source: reported financials, FY2025 company filings; Gartner operating margin and operating income per the FY2025 10-K [11].
Two things are true at once, and holding them together is the whole point. Gartner is winning the peer race decisively — extending its lead as the only profitable, growing pure-play — and its own forward moat metrics eroded, with both retention lines below 100% and contract value flat. The erosion is not in the product's economics: the Insights gross contribution margin held at 77% in both 2025 and 2024, unchanged [12]. A Gartner seat still earns roughly the same contribution it always did. What softened is the rate at which clients add and expand those seats — a demand condition, not a unit-cost one.
It is worth being precise about what kind of moat that leaves, because management is unusually candid about it. Gartner's own 10-K states that "limited barriers to entry exist in the markets in which we do business," names "free sources of information that are available to our clients through the internet," and anticipates "more competition with increased adoption of AI services" [13]; its risk factors describe markets "characterized by intense competition," including "information available on the internet free of charge" [14]. The written barrier is low. The demonstrated one — 2,400-plus experts, more than 510,000 direct client interactions a year, a proprietary research corpus no entrant can assemble quickly — is why no one has displaced Gartner in decades even though the legal wall is thin. The moat is brand, scale and proprietary content, and the profit ladder above shows it is real. The question is whether the first force in years capable of making that low written barrier actually bite — free AI answers — is arriving, and that is the last thread this chapter opens rather than closes.
The Federal Air Pocket
Before AI, one isolable and quantifiable slice of the 2025 stall needs to be pulled out, because it behaves like a one-off and can be sized. Gartner's Insights contract value with the US federal government was about $126.0 million at the end of 2025, and less than half of the prior-year federal book was retained in 2025 as government spending cuts hit [15]. A book that more than halved on a base that small does not sink a $5.16 billion contract value on its own, but it is large enough to bend the headline retention figures — and, being a discrete cancellation wave rather than gradual client defection, it annualizes out of the comparison rather than compounding.
The first-quarter 2026 numbers let you measure how much. Excluding the federal government, contract value grew 3.5% in Q1 2026, against reported total contract value growth of 1%; ex-federal GTS wallet retention was 99% versus 97% reported, and the remaining federal book had shrunk to about $114 million [16]. Management sized the drag directly: federal was a roughly 250-basis-point headwind in the quarter, and it expects that business to be flat in 2026 and grow from there as the cancellations lap [17]. Strip the federal air pocket out and the expansion engine is close to flat-to-slightly-positive rather than contracting — which is the crux of the cyclical case: a chunk of the 2025 damage was a policy shock that is already visible reversing in the run-rate.
That is the ex-federal read on its own terms, as a demand fact. Whether management's framing of the federal exposure held up against its earlier statements — how small and diversified it was said to be before it halved — is a matter for the credibility record, and belongs to the reconciliation of what was said against what happened (Said Versus Did).
The Force Both Sides Claim
The one variable that could turn a cyclical trough into a permanent step-down is the same one both Gartner and Forrester are betting on for growth — which is exactly why it is unresolved. Gartner's 10-K is explicit about the threat: large language models "provide substantive content in search results, including AI-generated content, which, if expanded to the areas in which we operate, could reduce the need to enter our websites," and clients "may load our proprietary information into large language models, which could reduce the value of our offerings" [18]. Free, fluent, always-available answers are a substitute for the commodity end of paid research, and the company says so in writing.
The same technology is also the product both firms are selling hardest. Gartner launched AskGartner, an AI tool over its own proprietary corpus, in August 2025, and its defense is that its insights are "available exclusively from Gartner" and cannot be reconstructed from a public model [19] [20]. Forrester goes further in the opposite direction, casting disruption as fuel: "the more disruption, the faster our business model will grow," with unique users of its AI product up 55% year over year and its defense resting on proprietary data, original analysis, and trust [21]. The two closest players in the category read the identical evidence in opposite directions — one names AI a disintermediation risk, the other an accelerant — and both retreat to the same shelter: exclusive content and trusted human experts.
That is where the diagnosis lands and where it stops. The 2025 stall is category-wide, not a Gartner execution failure; a measurable piece of it is a federal cancellation wave already reversing; and the leader is gaining share even as its own expansion metric turns negative. What the evidence cannot yet settle is whether below-100% wallet retention is the pandemic pattern repeating — a cyclical trough that snaps back once federal laps and budgets thaw — or the leading edge of AI substituting for the paid seat, in which case the expansion flywheel does not simply restart. That structural question sits underneath everything the later acts weigh against the price. First, though, the record: five years of what management promised about this engine, set against what it delivered.
Said Versus Did
Gartner gives a reader an unusually clean way to grade it. For five years management has repeated one concrete medium-term promise — that Research contract value grows 12% to 16% a year, and that double-digit revenue and modest margin expansion follow from it [1]. The number is specific, it is dated, and the transcript archive records both the claim and the outcome every quarter. That is the material of a credibility ledger: not whether the strategy is sound, but whether the word held.
The record is mixed in a way the headline revenue line hides. The operating promise — the growth algorithm behind the whole equity story — was missed by a widening margin every year and reaffirmed anyway, including at the November-2024 price peak. A risk framed as small and stable one quarter more than halved over the next four. A business once sold as a growth engine was divested as "not core." Against that sits one commitment delivered in full and then accelerated as the stock fell: the buyback. This act walks each in turn, then closes on how management is measured and paid around the exact segment that broke.
The Reaffirmed Model
The 12-to-16 model is not a slogan; it is the arithmetic the company guides to. At the February 2025 call the CFO put it plainly: "our financial model and expectations are unchanged. With 12% to 16% Research CV growth, we will deliver double-digit revenue growth" [2]. The Cash Machine established why contract value is the tell that matters — it is the forward-revenue balance the entire engine refills from. What the five-year series shows is that the tell moved one direction, monotonically, while the promise stayed fixed.
Realized total contract-value growth ran 16% / 12% / 8% / 8% / 1% (FY2021–FY2025); the reaffirmed medium-term objective was a 12–16% band throughout. Sources: Q4 FY2021 [3], Q4 FY2022 [4], Q4 FY2023 [5], Q4 FY2024 [6] and Q4 FY2025 [7] transcripts; revenue growth per reported financials.
Total contract value grew 16% into year-end 2021 [8], 12% in 2022 [9], 8% in 2023 [10], 8% again in 2024 [11], and 1% in 2025 [12]. The last print landed a full eleven points below the low end of the band management had reaffirmed twelve months earlier. Revenue growth tracked the same slope, from 15.5% in FY2021 to 3.7% in FY2025 — the deceleration was in the leading indicator and the reported line together, not a timing artifact between them.
The timing of the reaffirmation is what gives it weight. The February 2025 restatement of the unchanged model came with the shares near their November-2024 record of $551.80, and the CFO framed the year ahead as one in which contract-value growth "would continue to accelerate" [13]. It decelerated instead, to the 1% print, and the stock is down 74.6% from that high. By the February 2026 call an analyst put the pattern to management directly — that there had been "a number of challenging years where there's always something that disrupts your ability to hit that medium-term guidance" — and the 12-to-16 objective was maintained again, with the payoff placed "a couple of years" out. The evidence for the model is a decade of scale and cash; the evidence against it is five consecutive years of missing it by a widening gap. What would settle it is a single year of contract-value reacceleration back into the band — the test the closing act carries to the price.
The Federal Reassurance
The Engine Stalled sized the U.S.-federal cancellation wave and showed how much of the reported 1% it explains. The credibility question is separate and narrower: what management said about that exposure before it broke. Here the said-and-did sit one page apart in the same call.
Said, February 2025: "we ended 2024 with around $270 million of CV which is 5% of the total," spread "widely across agencies and departments," with almost all contracts running one year [14]. Asked on the same call whether the government book warranted a more conservative view, the CEO answered that the federal, state and local sectors "are very diversified, and that remains unchanged," with "no differences at this point" from the prior quarter [15]. The characterization was small, diversified, stable.
The federal book called "diversified" and "unchanged" in February 2025 more than halved over the next four quarters as one-year contracts came up for renewal. Sources: Q4 FY2024 [16], Q3 FY2025 [17], Q4 FY2025 [18] and Q1 FY2026 [19] transcripts.
Did: the $270 million became roughly $165 million by September 2025 [20], $126 million by December [21], and about $114 million by March 2026 [22] — more than halved in the fifteen months after it was called diversified and unchanged. The framing was not dishonest: the contracts were genuinely spread across agencies, and the "unchanged" observation was true of the run-rate on that February day. But it did not survive the renewal cycle, and it was offered at the moment a shareholder most needed the risk sized up rather than down. The useful read for later chapters is the discount to apply to contemporaneous management framing of a tail risk: outside the federal book, contract value was still growing 3.5% in the March-2026 quarter [23], so the reassurance about the isolable shock understated it precisely where it turned out to matter.
Digital Markets, Reclassified
The clearest instance of a said-then-unsaid promise is a whole business line. Gartner built and long promoted Digital Markets — the Capterra, GetApp and Software Advice software-review properties — as a growth engine adjacent to the research core. In 2025 it divested it. The CEO's explanation on the February 2026 call was that the business "didn't fit into that vision, so we made that decision after careful analysis" [24]; the CFO added that "we recognized that digital markets was not core to our business," to be sold "to a more natural owner" with proceeds redirected to the core [25].
A divestiture is not a broken promise on its own — pruning a non-core asset is ordinary capital discipline, and selling to a natural owner is the right move if the fit was wrong. What makes it a ledger entry is the reframing. A line once carried as evidence of the growth story was retired as "not core" in the same window the growth algorithm stalled, and management now describes the surrounding effort — a "BTI transformation" of the research product plus staff reductions — as the most significant change of the CEO's two-decade tenure. Whether that reset is a genuine sharpening of the core or a relabeling of a demand problem the company could not otherwise name is not yet decidable from the filings; the honest note is that a previously touted thread was quietly dropped rather than delivered.
The Kept Promise
Credibility runs both ways, and on capital return the record is unambiguous. Diluted share count fell every year, from 86.18 million in FY2021 to 75.61 million in FY2025 — about 12% of the company retired in five years — funded by cash repurchases of $1.66B, $1.04B, $606M, $735M and, in FY2025, a record roughly $2.0 billion [26]. Cash spent on acquisitions across those five years was zero. Where the operating model was serially missed, the buyback commitment was met and then leaned into: as the stock fell through the drawdown, the pace increased rather than paused.
FY2025 diluted shares (M)
Shares retired since FY2021 (M)
FY2025 buyback ($M)
Share count fell from 86.18M (FY2021) to 75.61M (FY2025), ~12% cumulative; FY2025 repurchases of ~$2.0B were the largest of the five years. Sources: FY2025 10-K repurchase disclosure [27]; annual amounts per reported financials.
The buying continued into 2026. In the first quarter management "reduced our share count by about 4%, buying back $535 million of stock" [28] — a quarter's pace that, annualized, would retire shares faster than any full year in the table. That the record repurchase was struck into a 75%-off drawdown, part debt-funded, is the substance of The Buyback Bet; the point for the credibility ledger is narrower and firmer. On the promise it could control directly — returning cash and shrinking the count — management did exactly what it said, without interruption, for five years.
Pay and the Carve-Out
How management is measured completes the ledger, because the incentive design routes around the segment that broke. Both 2025 plans exclude the U.S.-federal public-sector business by construction. The annual bonus — half EBITDA, half revenue — paid at 119.6% of target, on certified EBITDA of $1,537 million against a $1,463 million target [29]. The long-term performance shares, earned on a one-year contract-value goal, vested at 82.1% of target [30]. Both results, the proxy states, were struck "excluding our U.S. federal public sector Insights business" on an FX-neutral basis; the Compensation Committee set the goals that way because of the "unusual amount of volatility and uncertainty" in that book [31].
2025 cash bonus (% of target)
2025 PSUs earned (% of target)
Stock vs 3-yr high
Say-on-pay support
Bonus and PSU payouts, measured on segment-adjusted metrics that exclude the federal book, ran above and near target through a 74.6% peak-to-trough decline; shareholders ratified the pay program with 93% support. Sources: 2026 proxy CD&A [32], PSU results [33] and say-on-pay result [34]; drawdown per reported market data.
The mechanism is worth stating in plain terms. The federal cancellations are the piece of the decline management points to most often; they are also the piece the bonus and equity metrics are defined to leave out. So the payout formula measures performance around the exact segment whose collapse the company cites for the stock's fall — executives earned above-target cash and near-target equity in the same year the shares dropped by three-quarters [35]. The design is defensible in isolation: carving out a genuinely volatile public-sector book from a manager's scorecard is common practice, and the "long-term" plan resets its goal annually rather than over a multi-year window. But the two choices compound — a one-year performance window on the equity, and the exclusion of the segment that broke — so realized pay tracked the healthy core while the price tracked the whole.
Two structural facts sit alongside the pay outcome. Shareholders ratified the program with 93% say-on-pay support [36], so this is not a governance revolt in the making. And the person at the center of it is the same one throughout: Eugene Hall, CEO since August 2004 and Chairman since July 2024 [37], the only non-independent director on a thirteen-member board and the only executive whose employment agreement "obligates the Company to include him on the slate of nominees to be elected to our Board" for the agreement's term [38]. The oversight scaffolding around him is conventional — a lead independent director, all-independent committees, no related-party items — but the authority to set and reaffirm the medium-term model, and the board seat from which to defend it, are concentrated in one twenty-two-year incumbent.
The State of the Record
The ledger reads clearly on both sides. Broken, or at least serially unmet: the 12-to-16 contract-value model, missed five years running and reaffirmed at the peak; the "diversified and unchanged" federal reassurance, offered one quarter before that book more than halved; and Digital Markets, promoted as growth and retired as "not core." Kept: the buyback, delivered every year and accelerated into the drawdown. Measured around the break: an incentive design that excluded the failing segment and paid above target while the equity fell 74.6%.
Two live commitments a reader can hold management to, both dated and checkable. First, the reaffirmed medium-term model — 12% to 16% contract-value growth, with the payoff again placed "a couple of years" out on the February 2026 call; the falsifiable test is a single year back inside the band, and the next print is the FY2026 disclosure. Second, the buyback discipline the company has actually earned trust on — whether the record, partly debt-funded repurchase proves accretive or merely concentrates the bet is the question the capital-allocation act takes up next, where the cash the machine throws off meets the price the market is paying for it.
The Buyback Bet
The one promise Gartner kept while the operating model slipped was the promise to shrink the share count, and in FY2025 it kept that promise harder than ever — a record $1,991.1 million of stock repurchased, more than the company earned in cash that year, part-funded by a fresh $800 million bond, struck as the stock sat about three-quarters below its high [1]. To judge whether that was cheap capital well spent or a levered position in a still-falling asset, a reader first has to separate what the machine actually earns from what the income statement reports — because for three straight years those two numbers have diverged by hundreds of millions.
One channel for all the cash
Gartner does one thing with its surplus: it buys its own stock. There is no dividend. Acquisition spending over the last three years totals under $10 million — nothing in FY2025, $2.0 million in FY2024, $3.8 million in FY2023 — the only deal a $7.9 million tuck-in of a Czech sales agent, against which the company was actually a net seller, disposing of TalentNeuron in 2023 for about $161.1 million [2]. Capital expenditure runs near $115 million a year, under 2% of revenue [3]. The customer-funded, asset-light model leaves almost every dollar of operating cash flow discretionary, and management sends essentially all of it to the same place.
The scale of that single channel is easiest to see against the cash the business throws off. Across FY2021–FY2025 Gartner generated roughly $6.34 billion of operating cash flow and spent about $6.03 billion buying back stock — a payout of roughly 95%, with the balance sheet, not retained cash, absorbing the difference in the heaviest years.
Sources: FY2025 10-K, Consolidated Statements of Cash Flows [4]; operating cash flow FY2021–FY2022 per company filings, as reported.
The authority behind the program is standing and refreshed continuously: a $1.2 billion authorization in May 2015, an incremental $5.8 billion added between February 2021 and September 2025, and a further $500 million in January 2026, with $745.3 million still available at year-end. The 10-K states plainly that repurchases "will be funded by cash on hand and borrowings" [5]. Borrowing is not a backstop here; it is a named funding source, and in FY2025 the company used it.
The record year
FY2025 was the year the policy went to the balance sheet. Repurchases of $1,991.1 million exceeded the $1,290.4 million of operating cash flow, and after $115.1 million of capex the free cash flow the business actually produced was about $1,175 million — so the buyback ran roughly $816 million ahead of internally generated cash [6]. The gap was bridged by issuing $799.9 million of new long-term debt — the only such issuance in the five-year window — which lifted net debt from $526.8 million to about $1.26 billion [7].
The residual landed in the equity account. Because repurchases are booked into treasury stock against retained earnings, a record buyback into a shrinking net-income year drained book equity: total stockholders' equity fell from $1,359.2 million to $319.9 million in a single year, against a balance sheet carrying $6.5 billion of revenue and $3.0 billion of long-term debt [8].
FY2025 Buyback ($M)
Free Cash Flow ($M)
New Debt Issued ($M)
Year-End Equity ($M)
Sources: FY2025 10-K, Consolidated Statements of Cash Flows [9] and Consolidated Balance Sheets [10]; free cash flow derived from reported operating cash flow less capex.
What makes this the year's defining allocation decision is the price. The open-market repurchases in the fourth quarter of 2025 were executed at an average of $239.06 per share [11] — itself less than half the three-year high — and by mid-2026 the stock changed hands near $140, roughly 40% below what management paid. The same decision carries two readings: capital deployed at a price less than half its recent peak, or capital committed to an asset that kept falling after the purchase. Which reading holds depends on whether the drawdown was mispricing — the matter Priced For Impairment takes up, not one this chapter can settle. What this chapter can settle is what the shares are a claim on, and that is where the reported numbers mislead.
What the cash actually is
The reported bottom line is a poor guide to Gartner's earning power, because a large non-operating item lands in each of the last three years. FY2023 pre-tax income carried a $135.4 million gain on the TalentNeuron divestiture; FY2024 carried a $300.0 million gain on event-cancellation insurance claims and, below the operating line, roughly $161.9 million of net tax benefits from a December-2024 intercompany transfer of intellectual property — a benefit the cash-flow statement shows was almost entirely non-cash; and FY2025 absorbed a $150.0 million goodwill impairment [12] [13]. The impairment fell entirely on the Digital Markets reporting unit — the same business carried, then sold as non-core in early 2026 — after its long-term forecast was cut, and it is non-cash [14].
Stacked together, those items whipsaw the EPS line in a way the operations do not justify. Diluted earnings per share ran $11.08, then $16.00, then $9.65 — and the headline story of FY2025 is a 42% net-income collapse, from $1,253.7 million to $729.2 million [15]. Strip the two items that sit inside operating income — the FY2023 divestiture gain and the FY2025 impairment — and operating income was roughly flat to modestly higher across the three years, near $1,100 million, $1,156 million and $1,176 million. The engine did not fall 42%; the reported total did, because FY2024 was flattered by non-recurring gains and FY2025 was charged with a non-cash write-down.
Source: FY2025 10-K, Consolidated Statements of Operations [16]; MD and A Results of Operations for the tax benefit [17]. Operating income adjusted for the divestiture gain and impairment that sit within it; derived from reported figures.
Cash tells the cleaner story. Operating cash flow exceeded net income in every year of the window and fell only 13% in FY2025 — from $1,484.9 million to $1,290.4 million — against the 42% drop in reported profit [18]. The collection side is clean: fees receivable of $1,684.5 million actually fell year over year and were a $38.0 million source of cash, so there is no receivables build-up flattering revenue ahead of collections [19]. One honest caveat sits on the conversion ratio itself: operating cash flow at 1.77 times net income looks pristine partly because the $150 million impairment depressed the net-income denominator without touching cash. The quality signal is real, but the flattering arithmetic should be named.
The one accounting position worth flagging is the tax line the FY2024 benefit came from. The auditor's sole critical audit matter was the company's unrecognized tax benefits on transfer pricing, which had grown to $301.6 million by year-end from $257.5 million and $148.4 million in the two prior years [20]. The same intercompany-IP structure that lifted FY2024 earnings is the one the auditor singled out — a reminder that a chunk of the reported tax advantage remains contestable.
The engine's own tell
The cleanest forward signal in the statements is not on the income line at all — it is in how much cash the subscription base prepaid. Gartner's clients pay in advance, so the year-over-year change in deferred revenue measures whether forward billings are still growing faster than the revenue being recognized. For years that delta was a large tailwind, adding cash on top of earnings. In FY2025 it reversed.
Sources: FY2025 10-K, Consolidated Statements of Cash Flows for FY2023–FY2025 [21]; FY2023 10-K, Consolidated Statements of Cash Flows for FY2021–FY2022 [22].
The tailwind did not simply switch off; it decayed in step with the deceleration the earlier chapters traced. Deferred revenue added $324.1 million of cash in FY2021, when contract value was compounding in the mid-teens, then $297.1 million, then $169.9 million and $181.2 million — before turning to a $41.9 million drag in FY2025 [23] [24]. Total deferred revenues on the balance sheet rose only to about $2.81 billion, up a slim 1.8%, while recognized revenue grew nearly 4% — billings no longer outrunning the book [25]. This is the same flat contract value showing up in the cash statement one line at a time.
The timing matters for the bet. The working-capital engine subtracted about $223 million from cash generation in FY2025 versus what it contributed the year before — in the very year management chose to repurchase a record amount of stock and borrow to do it. The prepayment cushion that historically let cash conversion run above earnings is, for now, gone; forward cash generation leans on the recurring base and on contract value re-accelerating, not on the tailwind that padded the last several years.
Where the bet stands
Assembled in one place, the decision has a clear shape. Gartner returns essentially all its free cash through one instrument, at no dividend and with M&A dormant. In FY2025 it stretched that instrument past internally generated cash and onto the balance sheet, thinning equity to $320 million and lifting net debt while buying at an average price the market subsequently marked down by roughly 40%. The reported earnings the shares are a claim on are cleaner than the −42% headline suggests — operating income roughly flat, cash conversion still strong — but the customer-funded tailwind that made that cash conversion exceptional has reversed, so the margin of comfort funding future repurchases is thinner than the multi-year record implies.
Whether the record buyback compounds value per share or merely concentrates a still-impairing position depends on the price management paid, which this chapter deliberately leaves open. Management has already committed its capital to one answer — a leveraged, all-in position taken on the view that the drawdown was mispricing. What the market is actually paying, what that price implies about the business, and the concrete tests that would prove the view right or wrong are where the story goes next.
Priced For Impairment
The four acts before this one built the machine, watched its growth engine stall, weighed management's word against its record, and followed the cash into a record buyback. Each deferred the same thing: the price. Gartner trades at roughly $140, down 74.6% from a November-2024 high of $551.80, and the striking feature of that collapse is what did not fall with it. Forward earnings estimates are higher today than they were a quarter ago; the company still converts a 68%-plus gross margin into free cash flow well in excess of net income; guided revenue for 2026 is essentially flat, not shrinking. The decline is almost entirely the multiple. That is the fact this chapter has to explain — and the reason the cyclical-versus-structural question the tape has refused to settle is worth stating precisely rather than resolving by assertion.
A Company-Specific Re-Rating
A 74.6% drawdown is not, by itself, evidence of anything: broad sectors de-rate, and a research-and-data business could simply be moving with its group. The peer set says otherwise. Across the six names Gartner's own filings and the screen put beside it, the median drawdown from a trailing three-year high is 44.4%. Gartner's is 30 points deeper than that median — the second-worst in the group, behind only Clarivate — while the ratings-and-data majors that share its subscription economics barely moved: SPGI is off 20.1%, Informa 11.0%.
Source: price feeds as reported; drawdown from each name's trailing 3-year high, 2026-07-17; peer median −44.4%.
The read is that the market is pricing something particular to Gartner, not repricing information services as a class. A rates move or a sector rotation would have carried SPGI and Informa down with it; it did not. Whatever the tape is discounting, it is a Gartner-specific concern — which the next section narrows further.
The Decline Is the Multiple, Not the Earnings
The two down-moves that did most of the damage share an unusual signature: both landed on earnings beats. On August 5, 2025 the stock fell 27.6% in a day, from $336.71 to $243.93, after a quarter in which adjusted EPS of $3.53 beat the $3.31 consensus by 6.8%. On February 3, 2026 it fell another 20.9%, from $202.40 to $160.16, on a Q4 in which adjusted EPS of $3.94 beat $3.51 by 12.2% [1]. Prices fall on beats when the market marks down the forward model rather than the delivered quarter — here, the contract-value engine whose stall The Engine Stalled diagnosed.
Source: consensus and surprise per consensus feed; the Q4 result [2]; daily price moves as reported.
The clinching evidence that this is compression, not deterioration, sits in the estimate revisions. Over the window in which the shares fell from a January-2026 high near $248 to roughly $140 — a 43% slide — consensus normalized EPS did not follow them down. It went up: the 2026 estimate rose from $13.15 ninety days ago to $13.68, and the 2027 estimate from $14.72 to $15.31. The numerator held while the multiple halved again.
Source: consensus normalized EPS trend per consensus feed; share prices as reported.
Two things can be true at once, and both are. Each guidance update that accompanied a beat was soft — a lowered 2025 revenue outlook in August, a 2026 adjusted-EPS guide of $12.30 or more in February that sits below the $13.17 the company just delivered [3]. Yet analysts, looking past a guide that management built conservatively, marked their multi-year normalized numbers higher. The market repriced the durability of the model, not the earnings it is currently producing.
What $140 Capitalizes
At $140.19 the market values Gartner's equity at $10.6 billion and, with $1.26 billion of net debt, the enterprise at roughly $11.9 billion. Against consensus, that is about 10.2 times 2026 normalized EPS of $13.68, 10.9 times GAAP EPS of $12.90, and 7.5 times 2026 EBITDA — with a free-cash-flow yield near 11% on both trailing and forward cash generation.
Fwd P/E (2026 norm.)
EV / 2026 EBITDA
FCF Yield (2026E)
Drawdown From High
Source: market cap and net debt as reported; consensus 2026 normalized EPS, EBITDA and free cash flow per consensus feed; drawdown from trailing 3-year high.
The reason this multiple is worth dwelling on is the base it sits on. This is not a cyclical manufacturer at 10 times a peak. It is the recurring, prepaid subscription franchise laid out in The Cash Machine, still earning a 77% contribution margin on its Insights core, against guided 2026 revenue of $6.455 billion or more — flat to slightly higher on an FX-neutral basis versus 2025's $6.5 billion, with consensus modeling a 1.1% decline [4]. A near-11% cash yield with revenue roughly flat and EPS estimates rising is the arithmetic of a business the market has decided will not grow — and may quietly shrink — for a long time.
That arithmetic frames the two sides without deciding between them. A buyer at $140 collects a near-11% free-cash-flow yield and needs only for the franchise to hold its cash generation roughly flat; the price implies the federal cancellations lap, the AI threat is overstated or already discounted, and the contract value outside the U.S. federal government that still grew 4% in the fourth quarter is the real trend line [5]. A seller at the same price reads 10 times earnings as generous for an annuity that is beginning to melt: wallet retention has crossed below 100% — 96% at GTS, 99% at GBS — and total Insights contract value grew just 1%, the leading indicators of a base that spends less each year even as its logos stay [6].
My own read, offered once: the reported and guided record shows deceleration, not shrinkage — flat-to-positive FX-neutral revenue, a 77% contribution margin intact, rising consensus EPS, and cash conversion still above net income — so at 10 times earnings the price embeds a durable impairment the numbers have not yet corroborated. The strongest fact against that read is the one the bear leads with: wallet retention below 100% and flat contract value are precisely the metrics that would confirm structural shrinkage if they persist, and they are moving the wrong way. What would change the read is the contract-value trajectory over the next few quarters, which is where the evidence, not the rhetoric, will land.
The Sell Side, Uncommitted
The analysts who cover Gartner have not resolved this either, and their posture is its own data point. Their price targets cluster modestly above the stock — a mean of $162 and median of $164, roughly 16-17% above spot — with a high of $203 and a low of $120, so the current price sits only about 17% above the most bearish target on the sheet.
Source: analyst price-target distribution per consensus feed; spot $140.19 as reported (2026-07-17).
The recommendation mix is where the hesitation shows. Against those targets, the ratings are one strong buy, three buys, nine or ten holds, one sell and one strong sell — a consensus recommendation score of 2.8, squarely in hold territory. Modeled upside on paper, no conviction to back it. The sell side is, in effect, saying it does not know whether the de-rating overshot — the same uncertainty the price itself carries.
What Would Settle It
The honest state of the case is that the cyclical and structural stories are not yet separable from the reported numbers — but they are separable by evidence that arrives on a schedule. Four tests will do the separating, each tied to a line item, the filing it appears in, and a threshold that would move the read one way or the other.
Source: contract-value and retention KPIs [7]; U.S. federal exposure [8]; 2026 share-count assumption [9].
The first test is the cleanest. Roughly $126 million of Insights contract value sat with the U.S. federal government at year-end 2025, and less than half of the prior year's federal book was retained through the cancellations that followed the federal cost-cutting drive [10]. Management guides contract-value growth to accelerate through 2026 largely on that book annualizing; on its own math, removing the federal headwind with no assumption for net growth adds back around 200 basis points of CV growth [11]. If ex-federal contract value keeps compounding and total CV reaccelerates, the federal drag was a cyclical air pocket. If total CV stays pinned near 1% after the federal base laps, the weakness was never mostly federal.
The second test is the one that cannot be scheduled as neatly, and it is where the structural fear lives. Gartner's own 10-K names the mechanism plainly: large language models "provide substantive content in search results" that "could reduce the need to enter our websites," and clients loading proprietary Gartner content into an LLM "could reduce the value of our offerings" [12]. The same filing markets AI as growth — AskGartner, launched in August 2025, is positioned as a demand driver [13]. It is the battleground the whole category names; Forrester, Gartner's weakest direct peer, is organizing its defense around the same claim that proprietary, trusted content resists substitution. Wallet retention is the scoreboard: back above 100% would say a Gartner seat is worth more, not less, as AI proliferates; a further leg down would say the opposite.
The third and fourth tests measure whether management's responses work. The salesforce is the machinery behind contract value, and the cost discipline that protected 2025 margins — quota-bearing headcount guided to only low-single-digit growth at GTS and mid-single at GBS for 2026 [14] — either preserves selling capacity or quietly hollows it; new-business dollars, still running down about 5% outside the federal book, are the tell [15]. And the leveraged, all-in repurchase of The Buyback Bet has a built-in accretion test: the 2026 guide assumes buybacks only to offset dilution and less interest income, so realized EPS should clear $12.30 if the company keeps shrinking the count — while debt that rises without an EPS lift would mean the bet concentrated an impairing position rather than compounding value [16].
None of these is settled today, which is the accurate place to end. The price at $140 pays a near-11% cash yield to wait for the answers, and asks in return that the reader accept a franchise whose forward moat metrics are eroding at the same time its per-share cash claim is being concentrated. The case is most sensitive to the contract-value line — the metric that turns the cyclical story into the structural one, or back again — and it prints four times a year.
The numbers behind Gartner, Inc.: as-reported financial statements and company metrics for FY2021–FY2025, traced to the source filings, opened with the share-price history those statements have to justify. Every linked figure opens the exact page of the filing it was printed on, with the statement row highlighted. Amounts in US$ thousands unless noted.
Reading notes: Gartner reports in thousands of US dollars; all figures in this tab are in thousands as printed, except per-share (dollars), percentages, and counts. FY2021-FY2025 statement columns are each cited to that year's own Form 10-K (the income statement and cash-flow statement print three years; the balance sheet prints two). Revenue by segment: in Q2 2025 Gartner renamed its Research segment to Insights and, in Q3 2025, reclassified Gartner Digital Markets from Research to Other, recasting prior periods. FY2021-FY2024 'Research' (cited to each own 10-K) therefore corresponds to today's Insights plus Other; FY2025 shows the new Insights and Other lines. Because of this relabeling the segment rows do not carry a single sum-of-labels check across all years. Q3 2025 operating income fell to $86.3M on a $150.0M non-cash goodwill impairment; Q4 FY25 single-quarter income figures are taken from the Q4 2025 earnings release (Form 8-K), which prints in millions, so those anchors are in millions while the stored values remain in thousands.
Share Price — Full Available History — 33 Years
The stock closed at $140.19 on Jul 17, 2026 — up 34,743% over the window shown (+19.6% a year), trading between $0.39 and $551.80. At that close the stock trades at 15× FY2025 diluted EPS as reported below.
Source: market price feed, monthly closes, sampled from 8,246 source observations, Oct 1993–Jul 2026. Price return only, excludes dividends. Prices are split-adjusted (1:2 on Aug 29, 1994; 1:2 on Jun 29, 1995; 1:2 on Apr 01, 1996).
Market capitalization $11.8bn and enterprise value $13.0bn.
Market cap = 83.8M shares outstanding × the Jul 17, 2026 close of $140.19. Enterprise value adds total debt of $3.0bn and subtracts cash and equivalents of $1.7bn (net debt of $1.3bn), from the FY2025 balance sheet. Market-derived figures, shown without filing links.
FY2025 at a Glance
Revenue (US$ thousands)
Operating income (US$ thousands)
Net income (US$ thousands)
Diluted EPS
Source: FY2025 consolidated statements [1] [2] [3] [4]. Click any linked figure to open the filing page with the row highlighted.
Revenue by Segment
| Revenue by Segment | FY2021 | FY2022 | FY2023 | FY2024 | FY2025 |
|---|---|---|---|---|---|
| Research | 4,101,392 | 4,604,791 | 4,887,046 | 5,125,650 | — |
| Insights | — | — | — | — | 5,072,570 |
| Conferences | 214,449 | 389,273 | 505,164 | 583,224 | 644,743 |
| Consulting | 418,121 | 481,782 | 514,746 | 558,537 | 552,499 |
| Other | — | — | — | — | 227,414 |
| Total revenues | 4,733,962 | 5,475,846 | 5,906,956 | 6,267,411 | 6,497,226 |
| Total revenues growth, derived | — | +15.7% | +7.9% | +6.1% | +3.7% |
Source: Consolidated Statements of Operations — Revenues by reportable segment. In Q2 2025 the Research segment was renamed Insights and Gartner Digital Markets was reclassified from Research to Other; FY2021-FY2024 Research therefore includes what is now Insights plus Other. [1] [2] [3] [4]. Click any linked figure to open the filing page with the row highlighted.
Income Statement
Source: Consolidated Statements of Operations [1] [2] [3] [4]. Click any linked figure to open the filing page with the row highlighted.
Columns marked E are consensus analyst estimates from S&P Capital IQ (CapIQ), shown alongside reported results for direct comparison; they are not company guidance.
Estimate source: S&P Capital IQ (CapIQ) consensus, as of 2026-07-29. Estimate figures are S&P Capital IQ consensus (vendor data — no filing page links). EPS and net income use the normalized (adjusted) consensus where the street reports it. Line-item analyst models (segments, drivers, KPIs) are in the Visible Alpha tab.
Balance Sheet
Source: Consolidated Balance Sheets [5] [6] [7] [8]. Click any linked figure to open the filing page with the row highlighted.
Cash Flow
Source: Consolidated Statements of Cash Flows [9] [10] [11] [12]. Click any linked figure to open the filing page with the row highlighted.
Contract Value Retention (Insights)
| Contract Value Retention (Insights) | FY2021 | FY2022 | FY2023 | FY2024 | FY2025 |
|---|---|---|---|---|---|
| GTS contract value (FX-neutral) | 3,373,000 | 3,632,200 | 3,747,600 | 4,029,000 | 3,910,000 |
| GBS contract value (FX-neutral) | 874,000 | 1,028,200 | 1,091,000 | 1,233,000 | 1,245,000 |
| GTS wallet retention | 106.0% | 105.0% | 101.0% | 102.0% | 96.0% |
| GBS wallet retention | 115.0% | 112.0% | 107.0% | 106.0% | 99.0% |
| GBS client retention | 87.0% | 89.0% | 87.0% | 87.0% | 86.0% |
Source: company filings [13] [14] [15] [16]. Click any linked figure to open the filing page with the row highlighted.
Segment Gross Contribution
| Segment Gross Contribution | FY2021 | FY2022 | FY2023 | FY2024 | FY2025 |
|---|---|---|---|---|---|
| Insights gross contribution | 3,036,925 | 3,414,574 | 3,600,143 | 3,792,843 | 3,890,185 |
| Insights gross contribution margin | 74.0% | 74.0% | 74.0% | 74.0% | 77.0% |
| Conferences gross contribution | 133,748 | 210,726 | 253,739 | 281,409 | 322,844 |
| Conferences gross contribution margin | 62.0% | 54.0% | 50.0% | 48.0% | 50.0% |
| Consulting gross contribution | 158,843 | 189,834 | 181,501 | 203,292 | 186,430 |
| Consulting gross contribution margin | 38.0% | 39.0% | 35.0% | 36.0% | 34.0% |
Source: company filings [17] [13] [18] [14]. Click any linked figure to open the filing page with the row highlighted.
Consulting Operations
| Consulting Operations | FY2021 | FY2022 | FY2023 | FY2024 | FY2025 |
|---|---|---|---|---|---|
| Consulting backlog (FX-neutral) | 116,700 | 139,700 | 162,100 | 191,500 | 173,700 |
| Average billable headcount | 749 | 827 | 934 | 956 | 940 |
| Consultant utilization | 68.0% | 70.0% | 65.0% | 65.0% | 61.0% |
Source: company filings [17] [18] [19] [20]. Click any linked figure to open the filing page with the row highlighted.
Long-Term Record
| Fiscal year | Total revenues | Operating income | Net income | Diluted net income per share | Cash provided by operating activities |
|---|---|---|---|---|---|
| FY2016 | 2,444,540 | 305,141 | 193,582 | 2.31 | 365,632 |
| FY2017 | 3,311,494 | (6,329) | 3,279 | 0.04 | 254,517 |
| FY2018 | 3,975,454 | 259,715 | 122,456 | 1.33 | 471,158 |
| FY2019 | 4,245,321 | 370,087 | 233,290 | 2.56 | 565,436 |
| FY2020 | 4,099,403 | 490,150 | 266,745 | 2.96 | 903,278 |
| FY2021 | 4,733,962 | 915,751 | 793,560 | 9.21 | 1,312,470 |
| FY2022 | 5,475,846 | 1,100,106 | 807,799 | 9.96 | 1,101,422 |
| FY2023 | 5,906,956 | 1,236,894 | 882,466 | 11.08 | 1,155,737 |
| FY2024 | 6,267,411 | 1,156,287 | 1,253,715 | 16.00 | 1,484,922 |
| FY2025 | 6,497,226 | 1,025,711 | 729,231 | 9.65 | 1,290,365 |
Source: consolidated statements across filings; older years from the standardized feed [9] [1] [10] [2]. Click any linked figure to open the filing page with the row highlighted.
Operating KPIs
| KPI | FY2021 | FY2022 | FY2023 | FY2024 | FY2025 |
|---|---|---|---|---|---|
| Total contract value | — | — | — | 5,114,000 | 5,155,000 |
| Global Technology Sales client retention | — | — | — | 84.0% | 85.0% |
| Number of destination conferences | — | — | — | 51 | 53 |
| Destination conferences attendees | — | — | — | 86,625 | 83,727 |
Source: company-reported operating metrics [17] [13]. Click any linked figure to open the filing page with the row highlighted.
Analyst Consensus
Mean target
Median target
High target
Low target
Street ratings: 3 strong buy, 10 hold, 1 sell, 1 strong sell. Consensus: Hold.
Estimate source: S&P Capital IQ (CapIQ) consensus, as of 2026-07-29. Estimate figures are S&P Capital IQ consensus (vendor data — no filing page links). EPS and net income use the normalized (adjusted) consensus where the street reports it. Line-item analyst models (segments, drivers, KPIs) are in the Visible Alpha tab.
Traceability
314 of 339 figures on this page (93%) link to the filing page where they are printed — click a linked figure to open the source PDF at that page with the row highlighted. Unlinked figures come from standardized data feeds or pre-filing years.
Gartner reports in thousands of US dollars; all figures in this tab are in thousands as printed, except per-share (dollars), percentages, and counts.
FY2021-FY2025 statement columns are each cited to that year's own Form 10-K (the income statement and cash-flow statement print three years; the balance sheet prints two).
Revenue by segment: in Q2 2025 Gartner renamed its Research segment to Insights and, in Q3 2025, reclassified Gartner Digital Markets from Research to Other, recasting prior periods. FY2021-FY2024 'Research' (cited to each own 10-K) therefore corresponds to today's Insights plus Other; FY2025 shows the new Insights and Other lines. Because of this relabeling the segment rows do not carry a single sum-of-labels check across all years.
Q3 2025 operating income fell to $86.3M on a $150.0M non-cash goodwill impairment; Q4 FY25 single-quarter income figures are taken from the Q4 2025 earnings release (Form 8-K), which prints in millions, so those anchors are in millions while the stored values remain in thousands.
FY2016-FY2020 long-term figures are from the standardized SEC XBRL data feed and are shown without page links (those filings are not in the corpus); FY2021-FY2025 long-term figures are cited to the filings.
Gartner, Inc.'s management explains the business in its own materials. The slides below do the most of that work, pulled from the documents preserved in Sources. Each source link opens the complete presentation at that slide in a new tab.
First Quarter 2026 Results (Earnings Supplement) — Q1 2026
Gartner's most current earnings deck; the only presentation format it publishes. Carries full-year 2025 columns, so it doubles as the whole-business primer. · Open the full document →
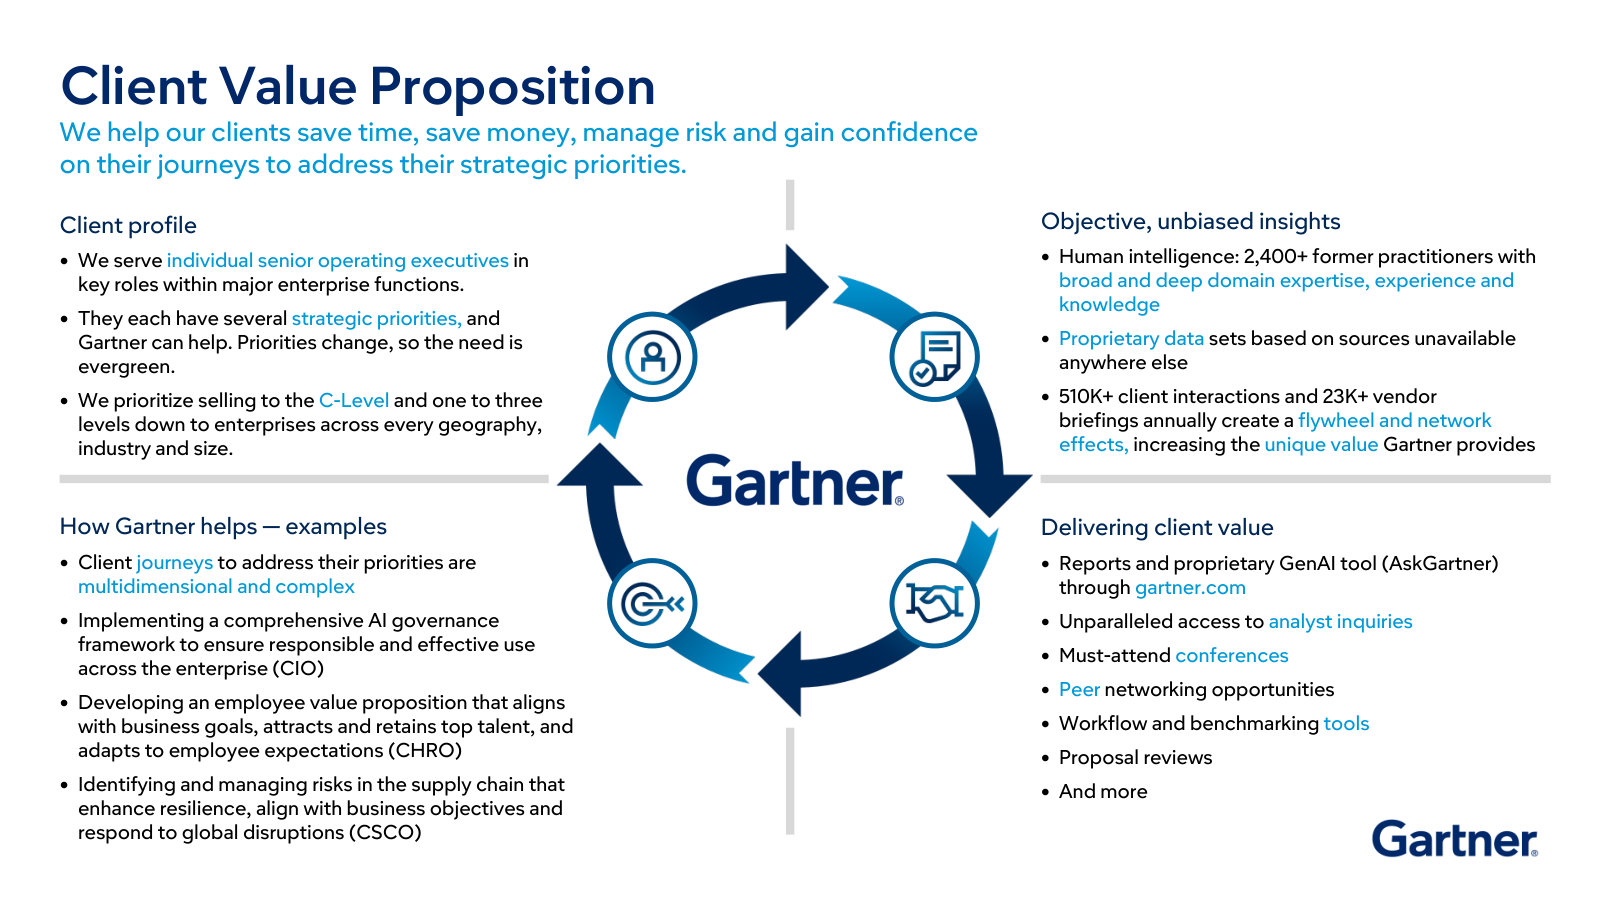
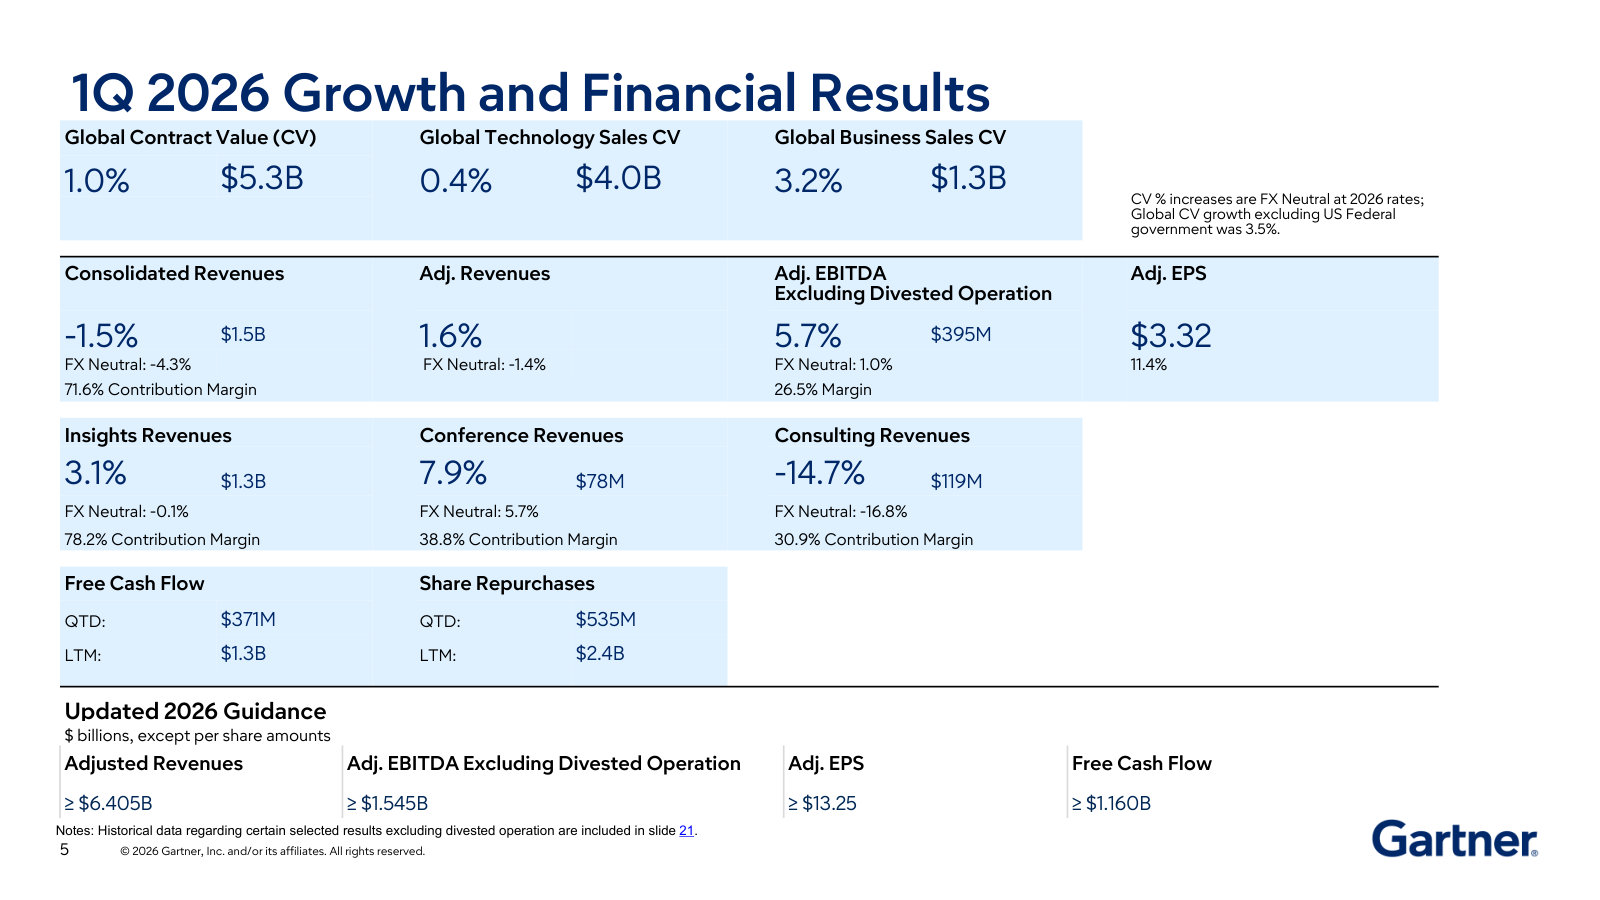
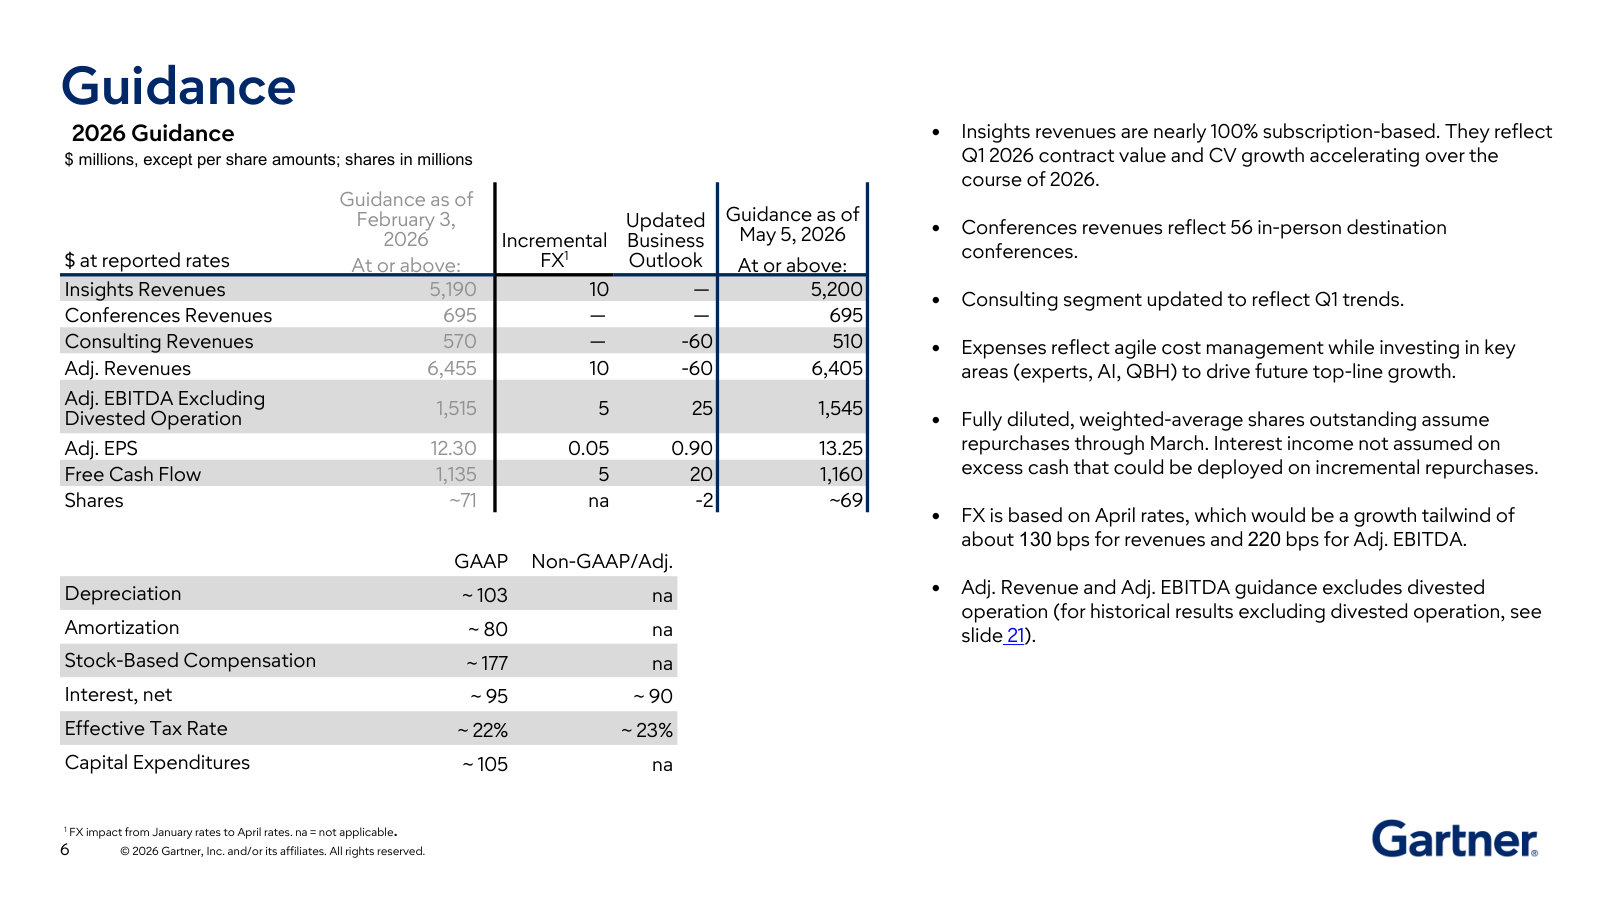
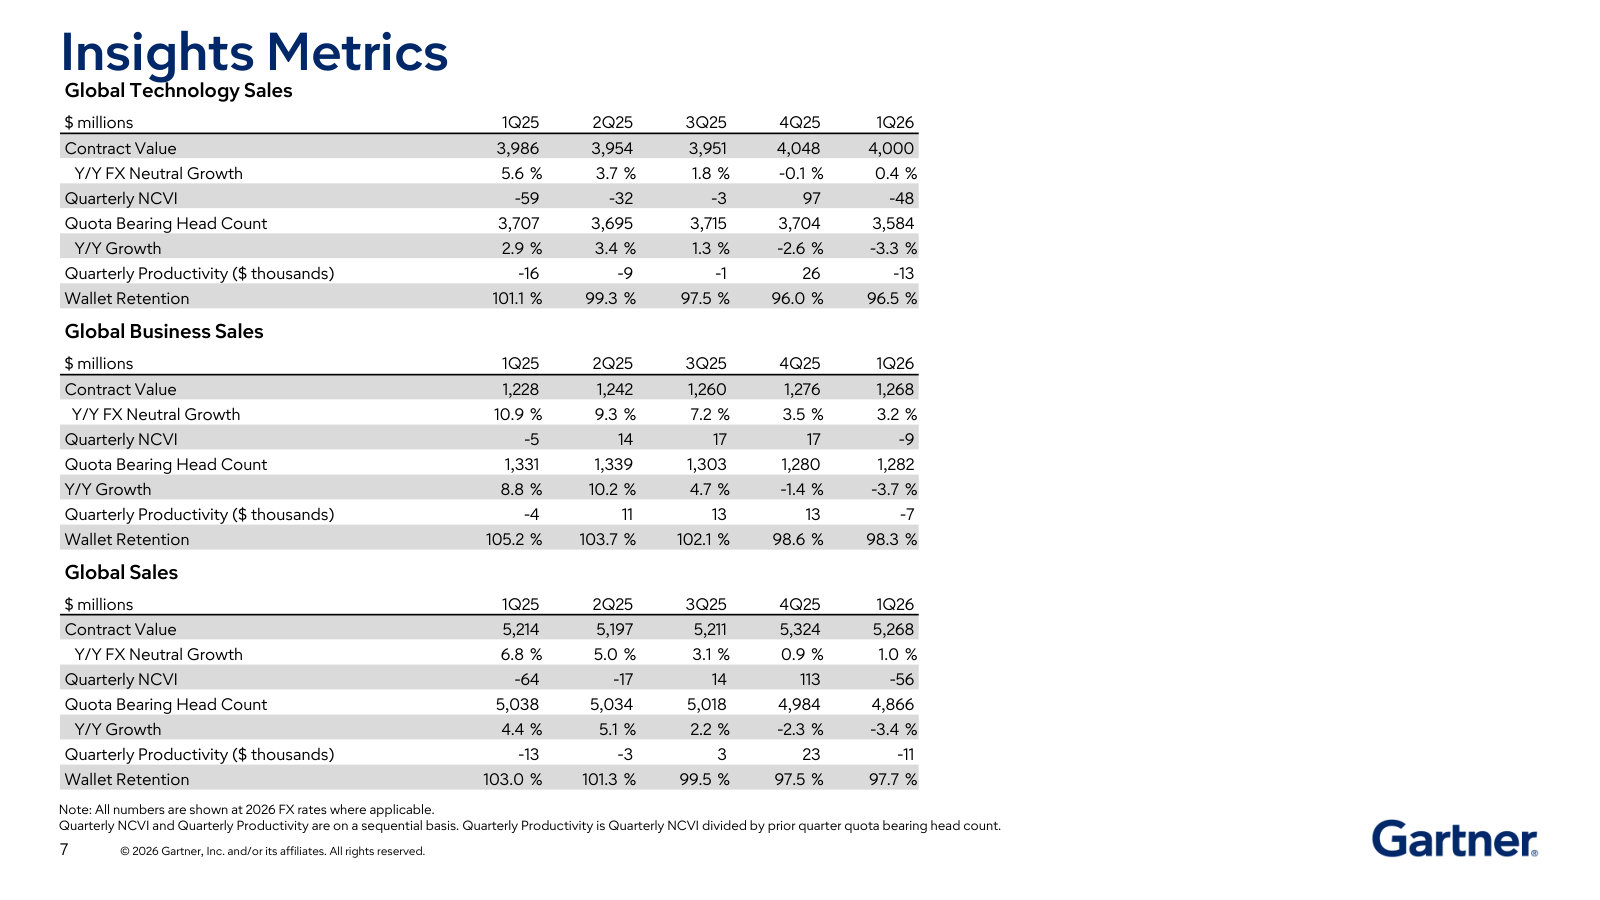
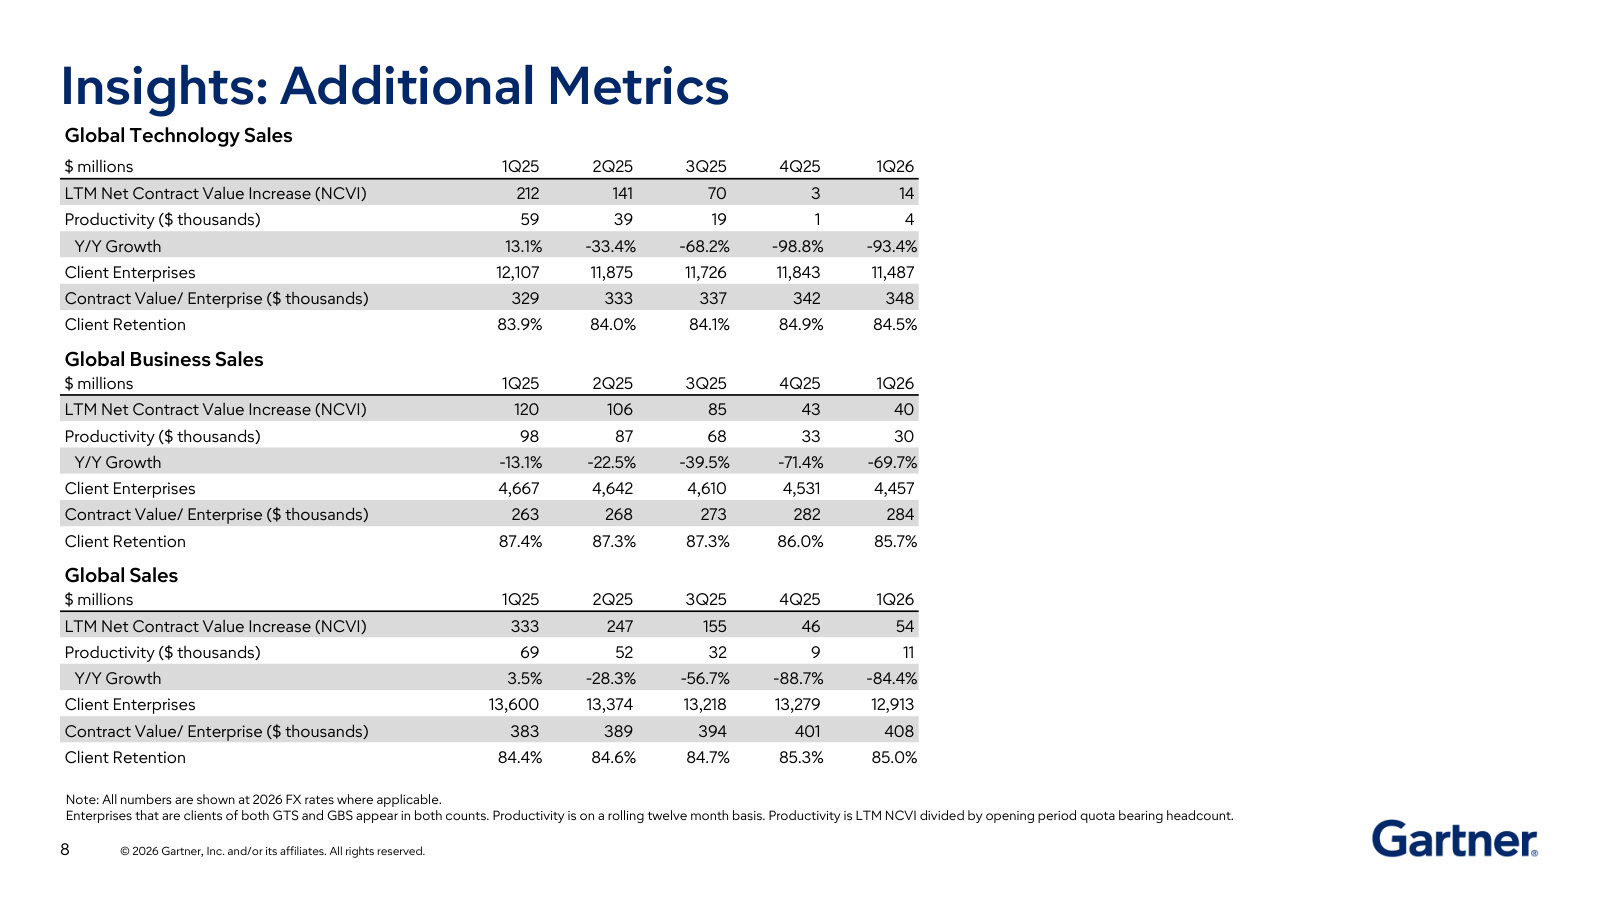
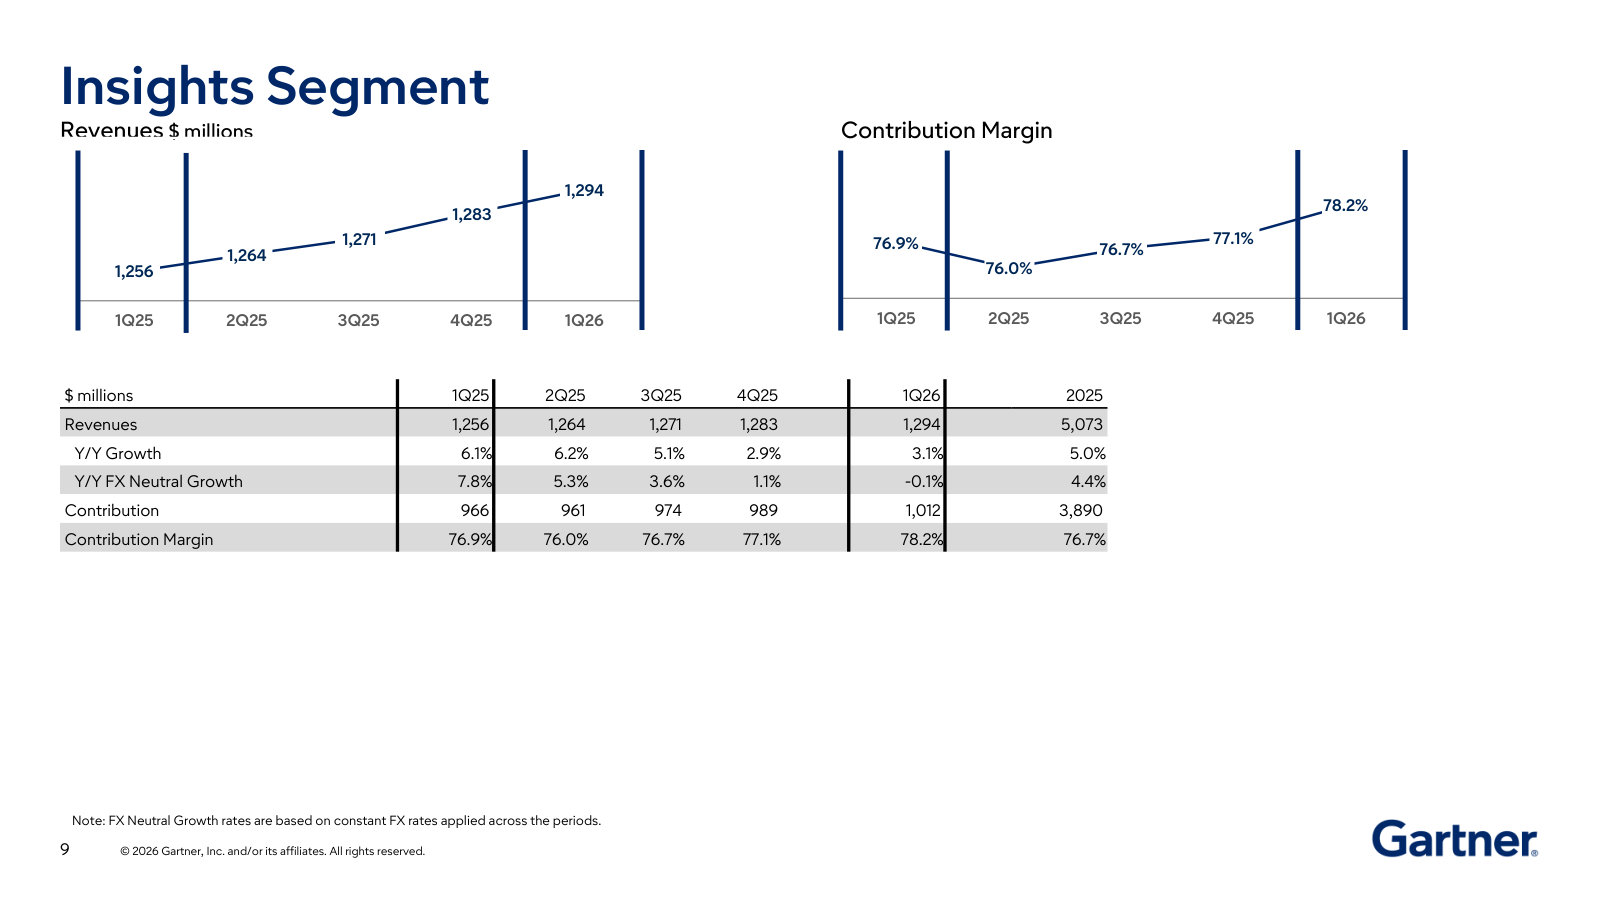
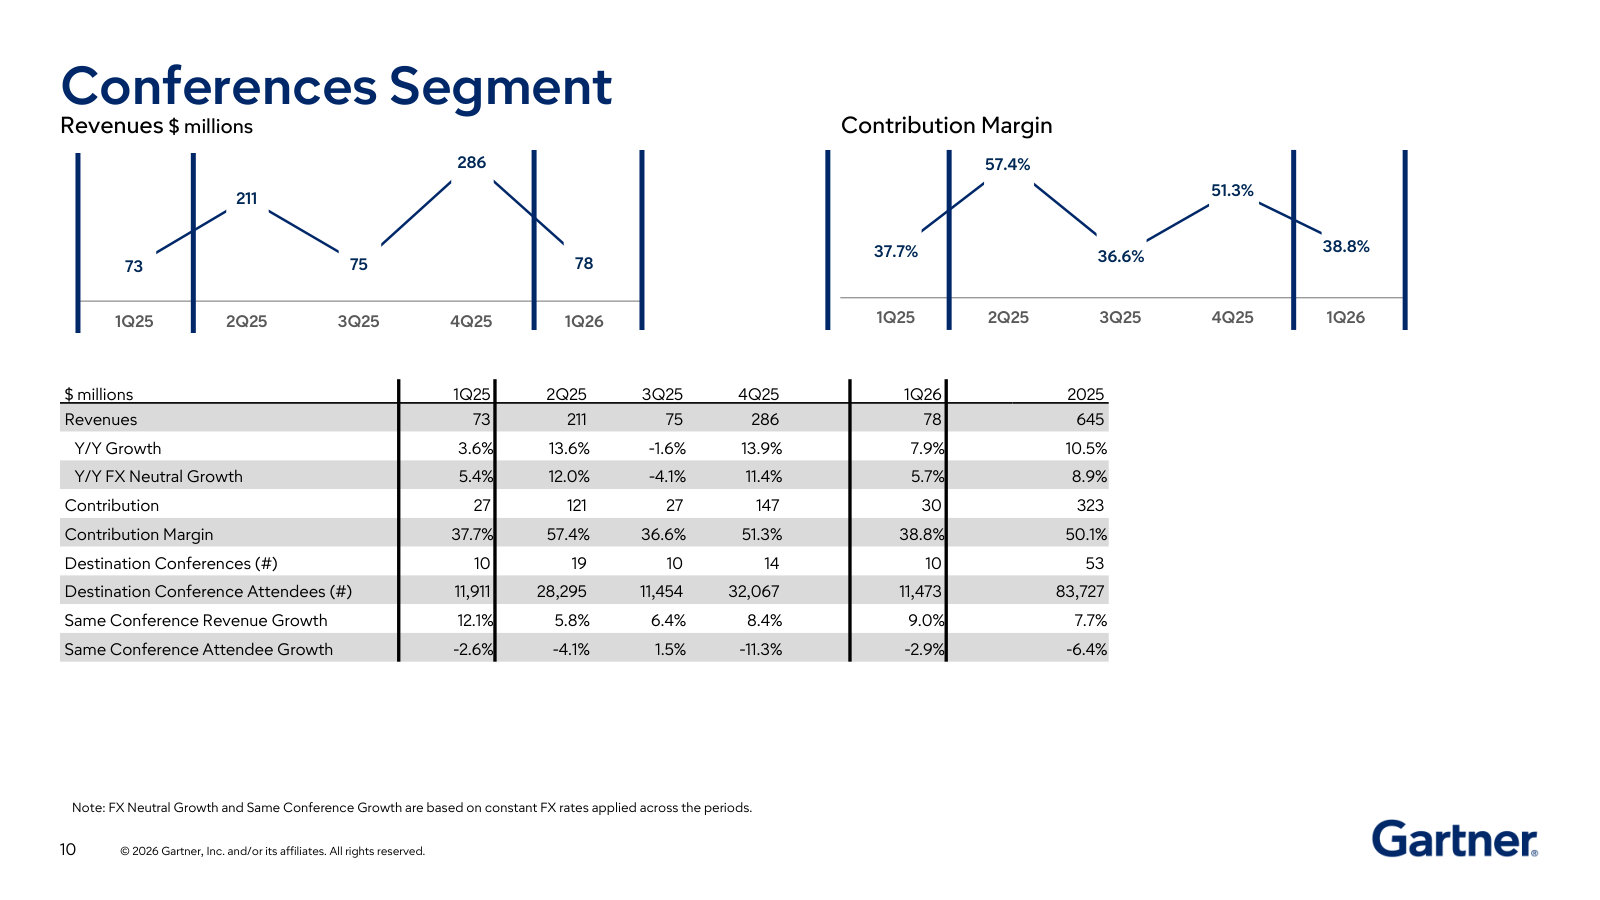
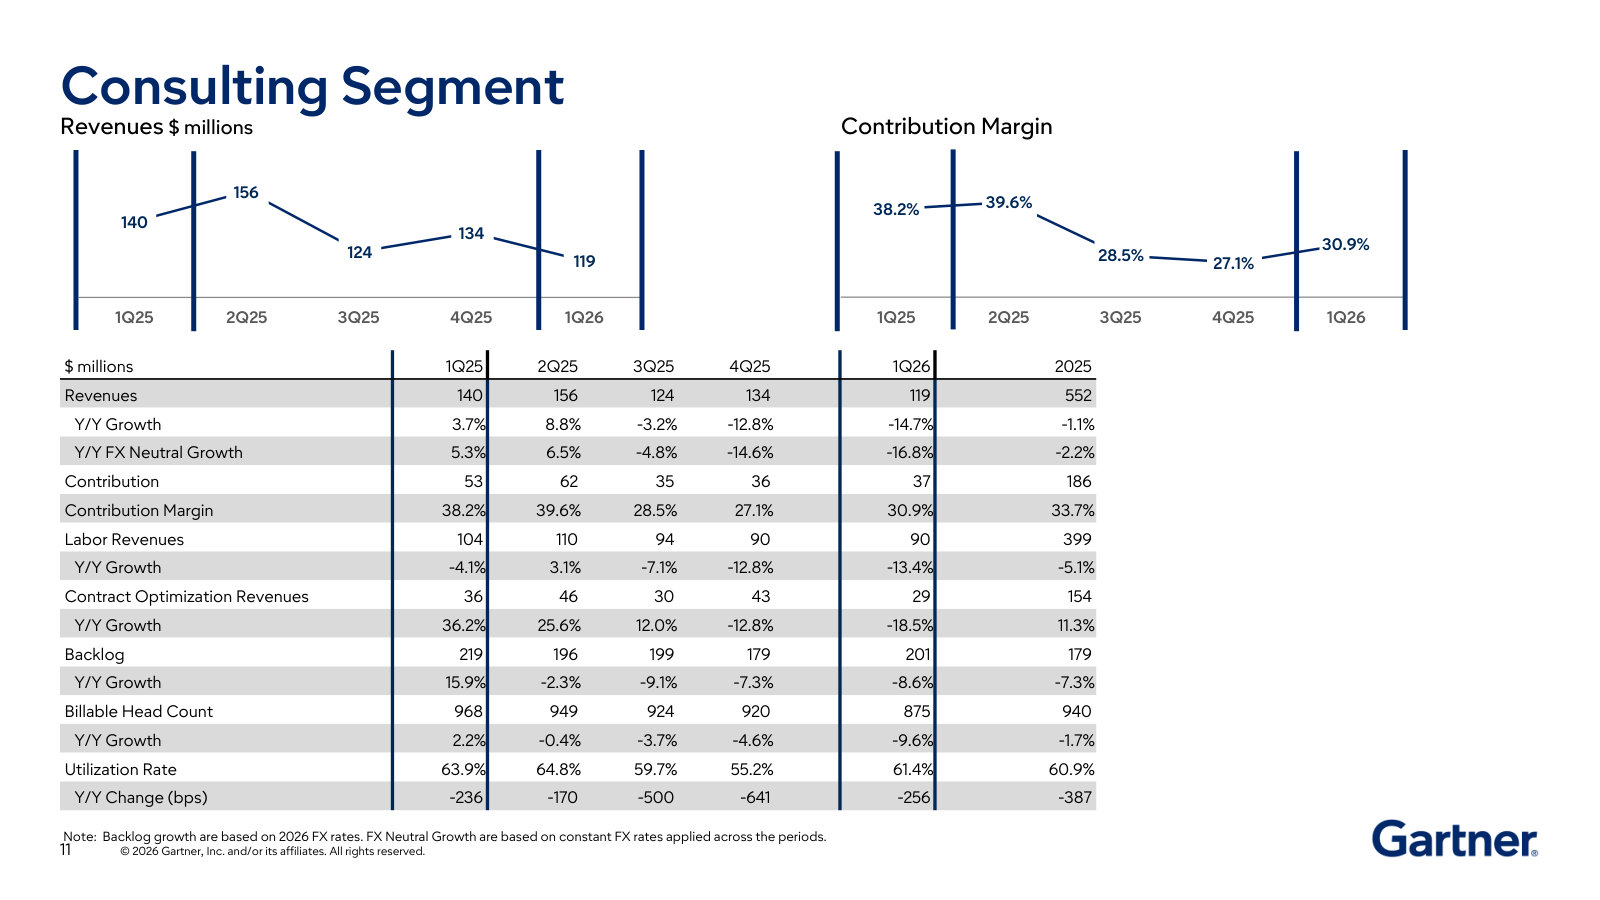
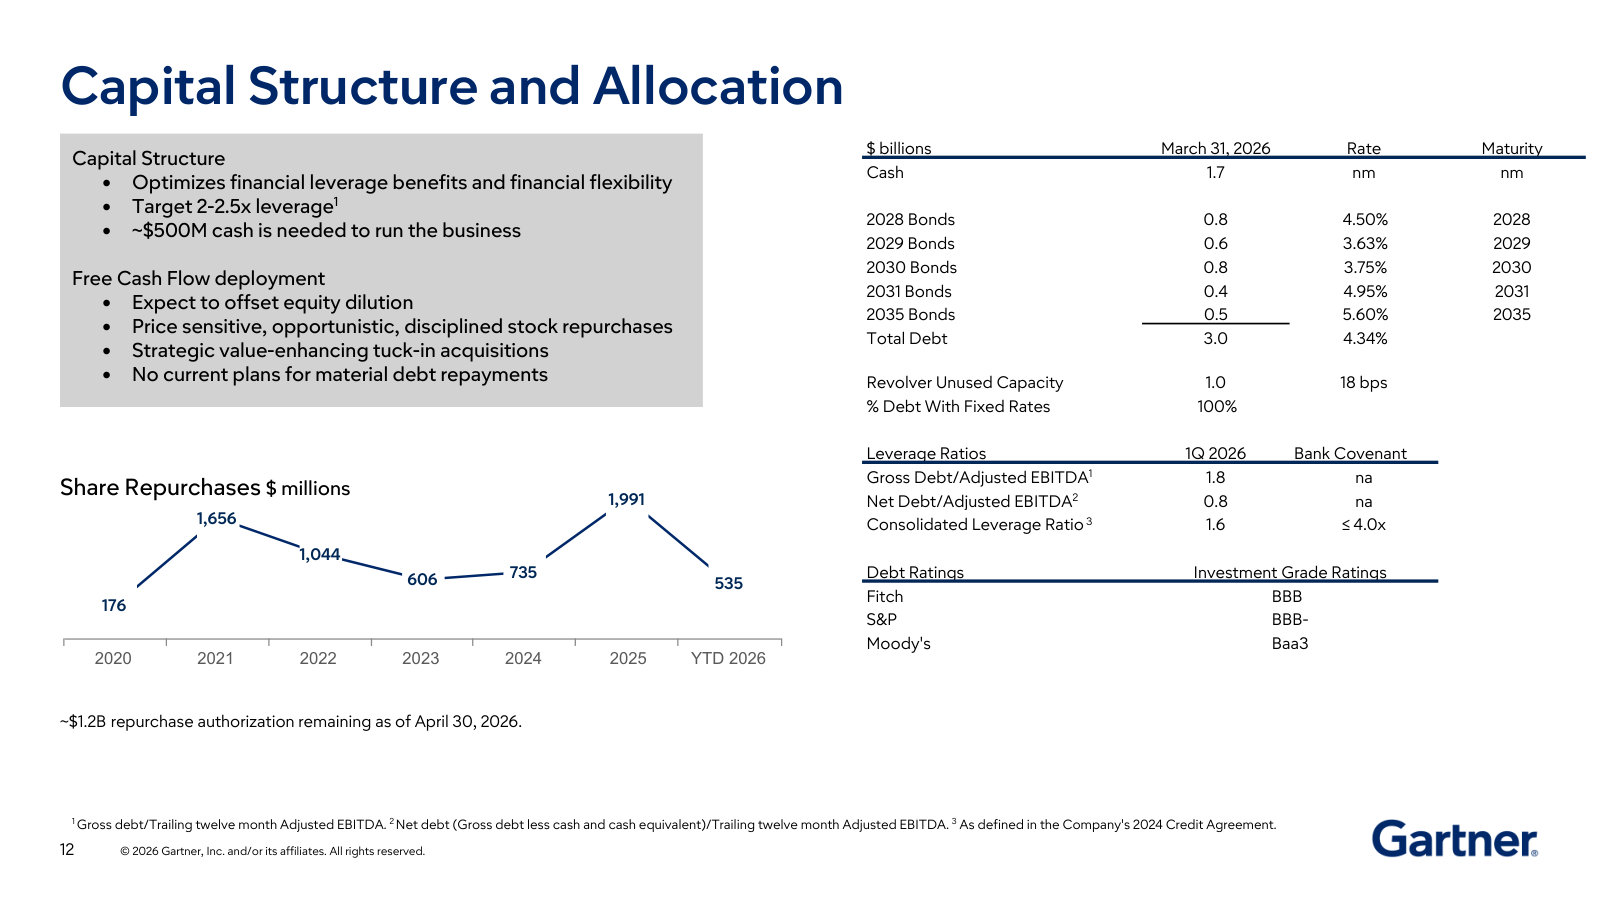
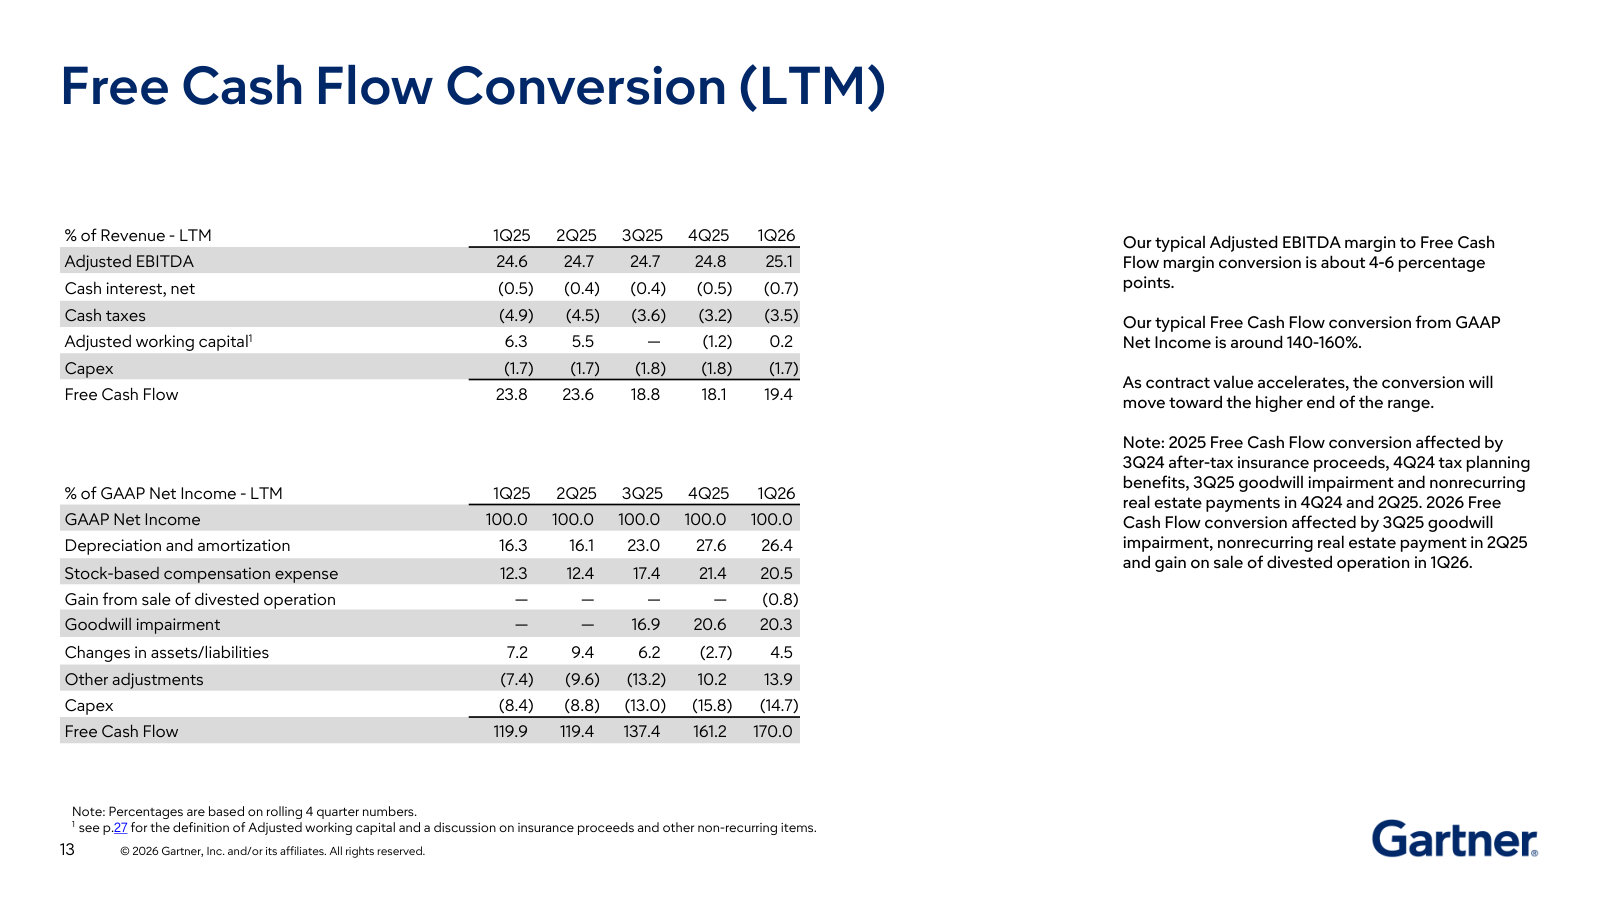
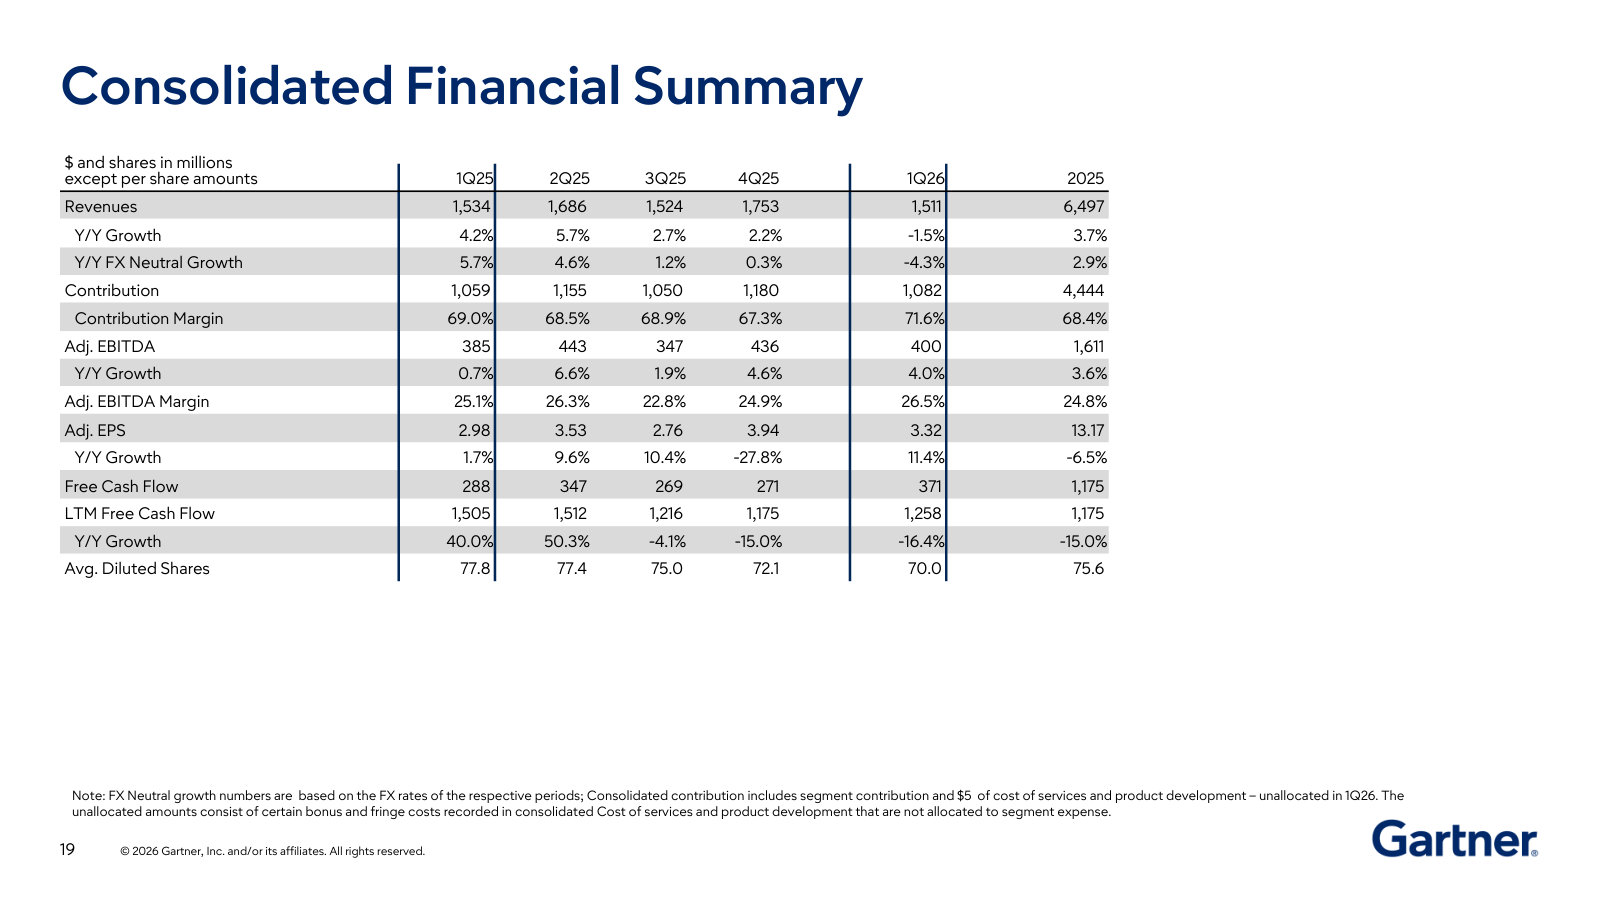
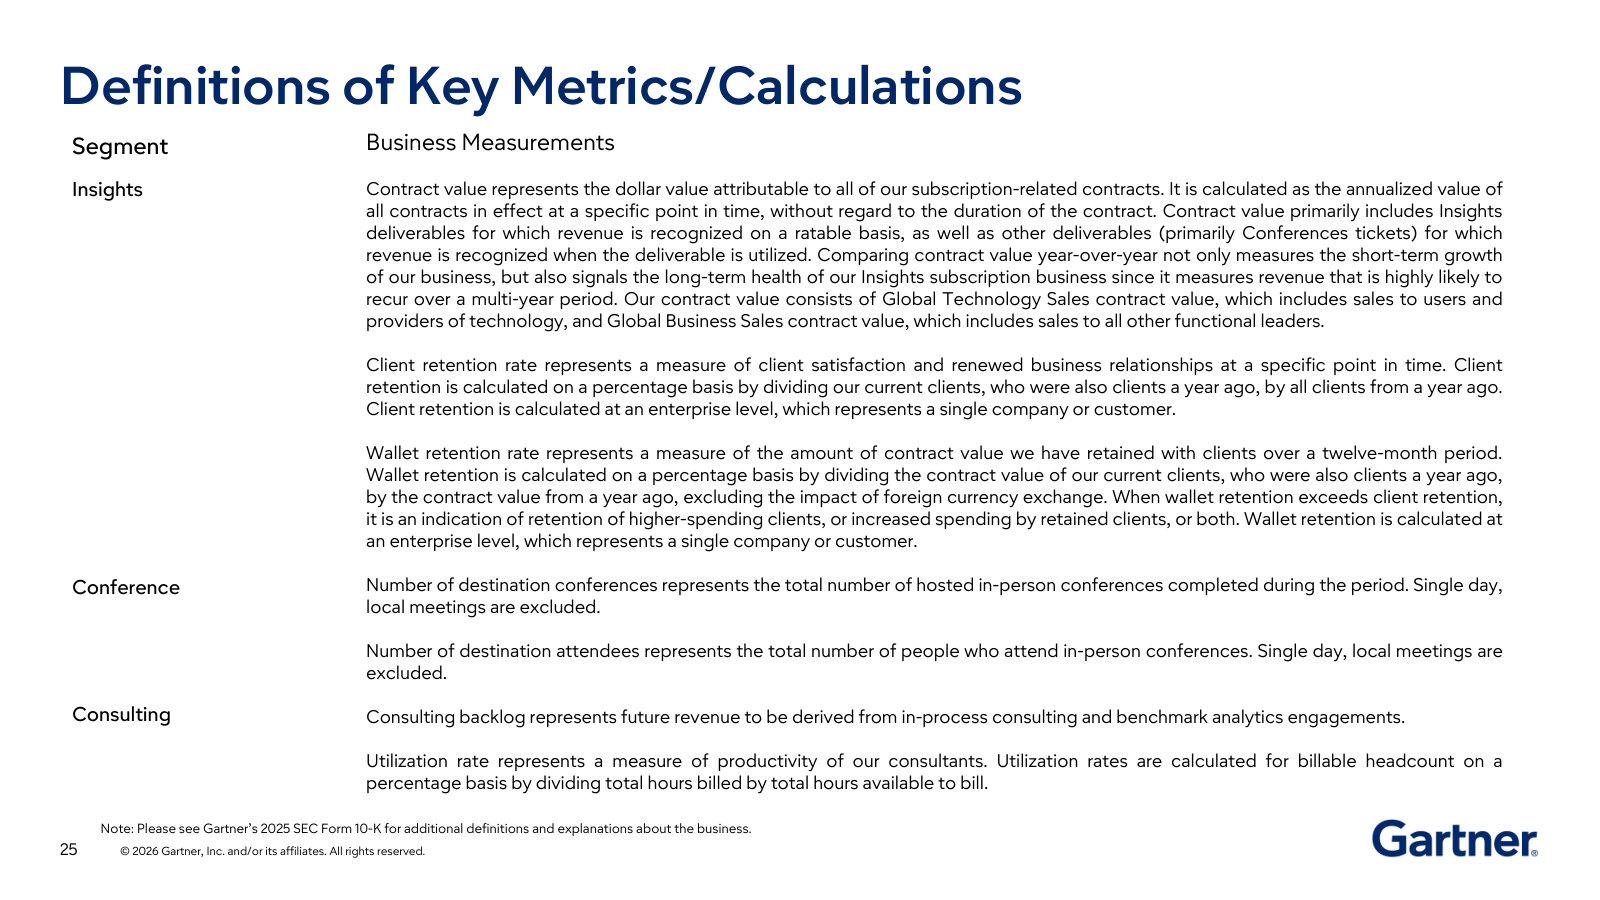
More from management
Fourth Quarter 2025 Results (Earnings Supplement) — Q4 / FY2025 · 33 pages · The full-year 2025 supplement and the original 2026 guidance the Q1 deck later updated; same layout as the featured deck. · Open →
Gartner, Inc.'s management answers for the business every quarter. These are the exchanges that explain it best — verbatim, from the call transcripts preserved in Sources. Each link opens the full transcript at that page in a new tab.
Q1 2026 Earnings Call — Q1 FY2026
The clearest current statement of what Gartner sells, why its subscriptions hold price, and where the federal drag now stands. · Open the full transcript →
The March air-pocket and April recovery — how decision delays, not losses, move the tape.
Gene Hall (Chairman & CEO); Jeff Mueller (Baird): we had really good January and February, and March decision-making slowed down. B and large, clients and prospects told us they still want to buy from us, but they couldn't make a decision at that time. To your point, as a rule, into April we're seeing many of those deals actually close where clients delayed in March but came through and closed in April.
p. 4 · Read in context →
Why Gartner holds price: it sells to the top of the org chart, at a small slice of the client's budget.
Craig Safian (CFO); Gene Hall (Chairman & CEO); Faiza Alwy (Deutsche Bank): We're starting at the top of the pyramid where there tends to be much less price sensitivity around those services. And again, if there is price sensitivity, there are offerings that we can provide to clients at different service levels. […] The other thing to think about is that Gartner spend is a very small part of a client's budget. Even our smallest clients have significant revenue, and the incremental difference in Gartner fees is typically a small fraction of their budgets. So price often isn't the primary factor for not buying; it's the broader budget decisions.
p. 6 · Read in context →
Sizing the shrinking federal book — $114M of CV left as the DOGE headwind laps.
Craig Safian (CFO); Andrew Nicholas (William Blair): we exited Q1 with about $114 million worth of U.S. federal CV spread across GTS and GBS, the bulk of that in GTS. What we saw from a renewal rate perspective in the quarter was a significant improvement on a year-over-year basis.
p. 6 · Read in context →
Q4 & Full-Year 2025 Earnings Call — Q4 FY2025
The full-year framing: the four-part transformation, the subscription economics, capital returns, and the engagement-drives-retention model that underpins the reacceleration case. · Open the full transcript →
Why the sell got harder — and the single lever that protects retention: client engagement.
Gene Hall (Chairman & CEO): Executives have responded to this by slowing and deferring everything possible. This makes for a much tougher selling environment. The value bar is higher, but it also represents a huge opportunity for us. […] Clients who engage frequently with our insights receive greater value and retain at higher rates. This was true in 2025 and every year prior; it is still true today.
p. 1 · Read in context →
The economics in one paragraph: subscription, paid upfront, free cash flow above net income.
Craig Safian (CFO): The Insight segment is our largest, most important business. It's subscription-based with strong retention, recurring revenue, and excellent contribution margins. We get paid upfront, which allows us to generate strong free cash flow well in excess of net income.
p. 3 · Read in context →
2025 capital allocation: first investment-grade bond, $2bn repurchased, digital markets sold.
Craig Safian (CFO): We increased leverage with a successful bond offering, our first as an investment-grade rated credit. We generated significant fre cash flow and bought back about $2 billion of stock. And last week, we entered into a definitive agreement to sell the digital markets business, which allows us to focus even more on delivering insights to help our clients address their mission-critical priorities.
p. 3 · Read in context →
Q2 2025 Earnings Call — Q2 FY2025
Where the two central bear questions — DOGE-driven federal collapse and AI disruption of research — were put to management most directly, and where AskGartner and the data moat were laid out. · Open the full transcript →
How sales capacity is actively reallocated — cutting weak territories, funding higher-opportunity ones.
Craig W. Safian (CFO): we have a practice, which we call territory optimization, which is every time we see turnover, we take a look to see if there's a better investment for us to make. […] trading out poor performing territories or less profitable territories or territories with more opportunity in the short, medium and long term is a no-brainer to do.
p. 12 · Read in context →
The sharpest AI-threat question: are clients cancelling to use public LLMs? Management says it's unmeasurable.
Jason Daniel Haas (Wells Fargo); Eugene A. Hall (CEO): Are you able to give us any sense of what percentage of folks are citing usage of like a publicly available large language model and therefore, not consuming the Gartner subscription? Is that coming up at all? What percentage is that? […] Yes, that's one of the options, and it's not significant. It's essentially unmeasurable.
p. 13 · Read in context →
Q1 2025 Earnings Call — Q1 FY2025
The quarter the U.S. federal end-market broke; the fullest quantification of the exposure and how management chose to guide and manage costs through it. · Open the full transcript →
The shock, quantified: 80% of the sequential CV decline was federal; federal retention ~50% on $225M of CV.
Craig Safian (CFO): Contract value was $5.1 billion at the end of the first quarter, up 7% versus the prior year. Contract value and CV growth are FX neutral. Excluding the U.S. Federal government, CV grew 8%. Contract value growth with tech vendors continued to improve. Global CV was $63 million lower than Q4 2024, with around 80% of the change attributable to the U.S. Federal government end market. […] Nearly all of our U.S. federal contracts will come up for renewal during 2025, with about 40% having transacted in Q1, the largest quarter of this calendar year. In the first quarter, the dollar retention was almost 50%. At March 31, we had $225 million of U.S. federal CV.
p. 3 · Read in context →
How federal cancellations flow through the numbers — $30M of termination notices still counted in CV.
Craig Safian (CFO); Jeffrey Meuler (Baird): we've got about $30 million worth of termination notices related to contracts that are set to expire later in the year. One way to think about it is it's sort of just normal course. We've just been notified ahead that those things will not be renewing or they will or would have the termination notice in hand. That $30 million remains in contract value because we are continuing to recognize the revenue on it.
p. 6 · Read in context →
Anatomy of a $135M research guidance cut: federal was the outlier; the rest was prudence and Q1 run-rate.
Craig Safian (CFO); George Tong (Goldman Sachs): Your business outlook for 2025 research revenue was downwardly revised by $135 million. Can you elaborate on how much of this reflects updated views on federal contract renewals versu updated views on other customer segments like tech vendors and enterprise functional leaders? […] we took our Q1 experience and we flowed that through across our contract expirations for the balance of the year. We took what we knew specifically about U.S. federal government. We modeled in the new FX rates. And as always, we try and take a prudent approach to how we approach our guidance for the full year.
p. 7 · Read in context →
Guidance philosophy under stress: margins up while revenue is cut — 'belt tightening,' not braking on growth.
Craig Safian (CFO); Joshua Chan (UBS): we're taking the opportunity to make sure that we are managing our operating expense base super prudently and super carefully. But also making sure that we're investing in areas that we know support and drive future growth. We're in a period right now where our CV is growing, call it, mid- to high single digits. Obviously, we firmly believe that we can be at 12% to 16% growth on the research business at a double-digit grow on the overall top line, and we want to make sure that we don't do anything that damages or impedes our ability to get back there when the economic situation is more normal. And so, what we're doing is, I'd call it like a slight belt tightening across the board as we're seeing a little bit of pressure in some areas, but also making sure that we're growing our selling capacity because we know that's a key ingredient going forward. So, we're not chopping anything. We're not slamming on the brakes on anything.
p. 8 · Read in context →
More calls
Q3 2025 Earnings Call — Q3 FY2025 · 12 pages · The mid-year read on whether ex-federal CV was reaccelerating and whether the DOGE and tariff headwinds were beginning to lap, alongside more on the insights transformation. · Open →
Q4 & Full-Year 2024 Earnings Call — Q4 FY2024 · 12 pages · Where the federal risk and the tech-vendor recovery were first framed, and the original 2025 guide the later cuts were measured against. · Open →
Q1 2024 Earnings Call — Q1 FY2024 · 12 pages · The clearest account of the tech-vendor trough and recovery and of AI emerging as the top client demand topic, before the federal shock. · Open →
Q4 & Full-Year 2023 Earnings Call — Q4 FY2023 · 20 pages · The full-year 2023 strategy baseline and tech-vendor softness that set up the 2024-25 story. · Open →
Q4 & Full-Year 2022 Earnings Call — Q4 FY2022 · 19 pages · The peak-growth year framing — record CV growth and the long-term 12–16% research CV algorithm in a strong macro. · Open →
Q2 2021 Earnings Call — Q2 FY2021 · 30 pages · The post-COVID reacceleration and a fuller walk-through of the operating model and long-term margin framework. · Open →
Gartner, Inc.'s annual reports contain management's most considered account of the business. These are the sections, passages and visual pages worth opening in the originals preserved in Sources.
Gartner, Inc. — FY2025 Annual Report (Form 10-K) — FY2025
The latest 10-K: three-segment subscription model, the 2025 Research→Insights rename, and a rare down year on a goodwill impairment. · Open the full document →
Item 1. Business — p. 4 · Read the full section →
How Gartner is built — three segments (Insights, Conferences, Consulting) sold as renewable subscriptions to ~13,000 enterprises.
Three reportable segments, the 2025 Research→Insights rename, and the Digital Markets divestiture.
Gartner delivers its products and services globally through three reportable segments – Business and Technology Insights, Conferences and Consulting, as described below. In the second quarter of 2025, we renamed our segment previously referred to as Research to Business and Technology Insights (or “Insights”) to reflect the nature of the value we provide to clients. In the third quarter of 2025, we changed the structure of our internal organization and concluded that Gartner Digital Markets (“Digital Markets”) was an operating segment but does not meet the criteria of a reportable segment. Accordingly, Digital Markets results are now included in “Other” where segment information is provided. Digital Markets was previously included in our Insights segment. Prior periods have been recast to conform to current period presentation. On February 5, 2026, we completed the sale of Digital Markets for approximately $110.0 million, prior to customary purchase price adjustments.
p. 4 · Read in context →
The Insights engine: subscription access to 2,400+ experts; 77% of contracts are multi-year.
Gartner delivers independent, objective insights to leaders across an enterprise through subscription services that include on-demand access to published content, data and benchmarks, and direct access to a network of more than 2,400 business and technology experts located around the globe. […] Clients normally sign subscription contracts that provide access to our content and advisory services for individual users over a defined period. We typically have a minimum contract period of twelve months for our insights subscription contracts and, at December 31, 2025, 77% of our contracts were multi-year.
p. 6 · Read in context →
Item 1A. Risk Factors — p. 12 · Read the full section →
The two risks specific to a research publisher — AI/LLMs disintermediating its content, and dependence on subscription renewals.
Search engines, LLMs and AI chatbots could serve Gartner's content and reduce the need to visit its sites.
In addition, some of our content is exposed to Internet search engines and large language models (“LLM”), which help generate website traffic. Search engines and LLMs often update their proprietary algorithms, which affects the placement of links to our websites. Some search engines and LLMs also provide substantive content in search results, including AI-generated content, which, if expanded to the areas in which we operate, could reduce the need to enter our websites. When a major search engine or LLM changes its algorithms in a manner that negatively affects our placement in search results or makes it less likely for our target audience to enter our websites, our business, results of operations and financial position may be harmed. Similarly, some of our content is exposed to the datasets leveraged by AI chatbots, and these chatbots may provide substantive content, either with or without contribution, in query responses to users which could reduce the need to enter our websites.
p. 14 · Read in context →
Subscription renewals and new sales are ~78% of revenue — the model's central dependency.
Our Insights business depends on renewals of subscription-based services and sales of new subscription-based services for a significant portion of our revenue, and our failure to renew at historical rates or generate new sales of such services will lead to a decrease in our revenues. A large portion of our success depends on our ability to generate renewals of our subscription-based insights products and services and new sales of such products and services, both to new clients and existing clients. These products and services constituted approximately 78% and 77% of total revenues from our operations for 2025 and 2024, respectively.
p. 14 · Read in context →
Item 7. Management's Discussion and Analysis of Financial Condition and Results of Operations — p. 35 · Read the full section →
Management's read on the year, plus the KPI framework (Contract Value, retention) that governs how the business is measured.
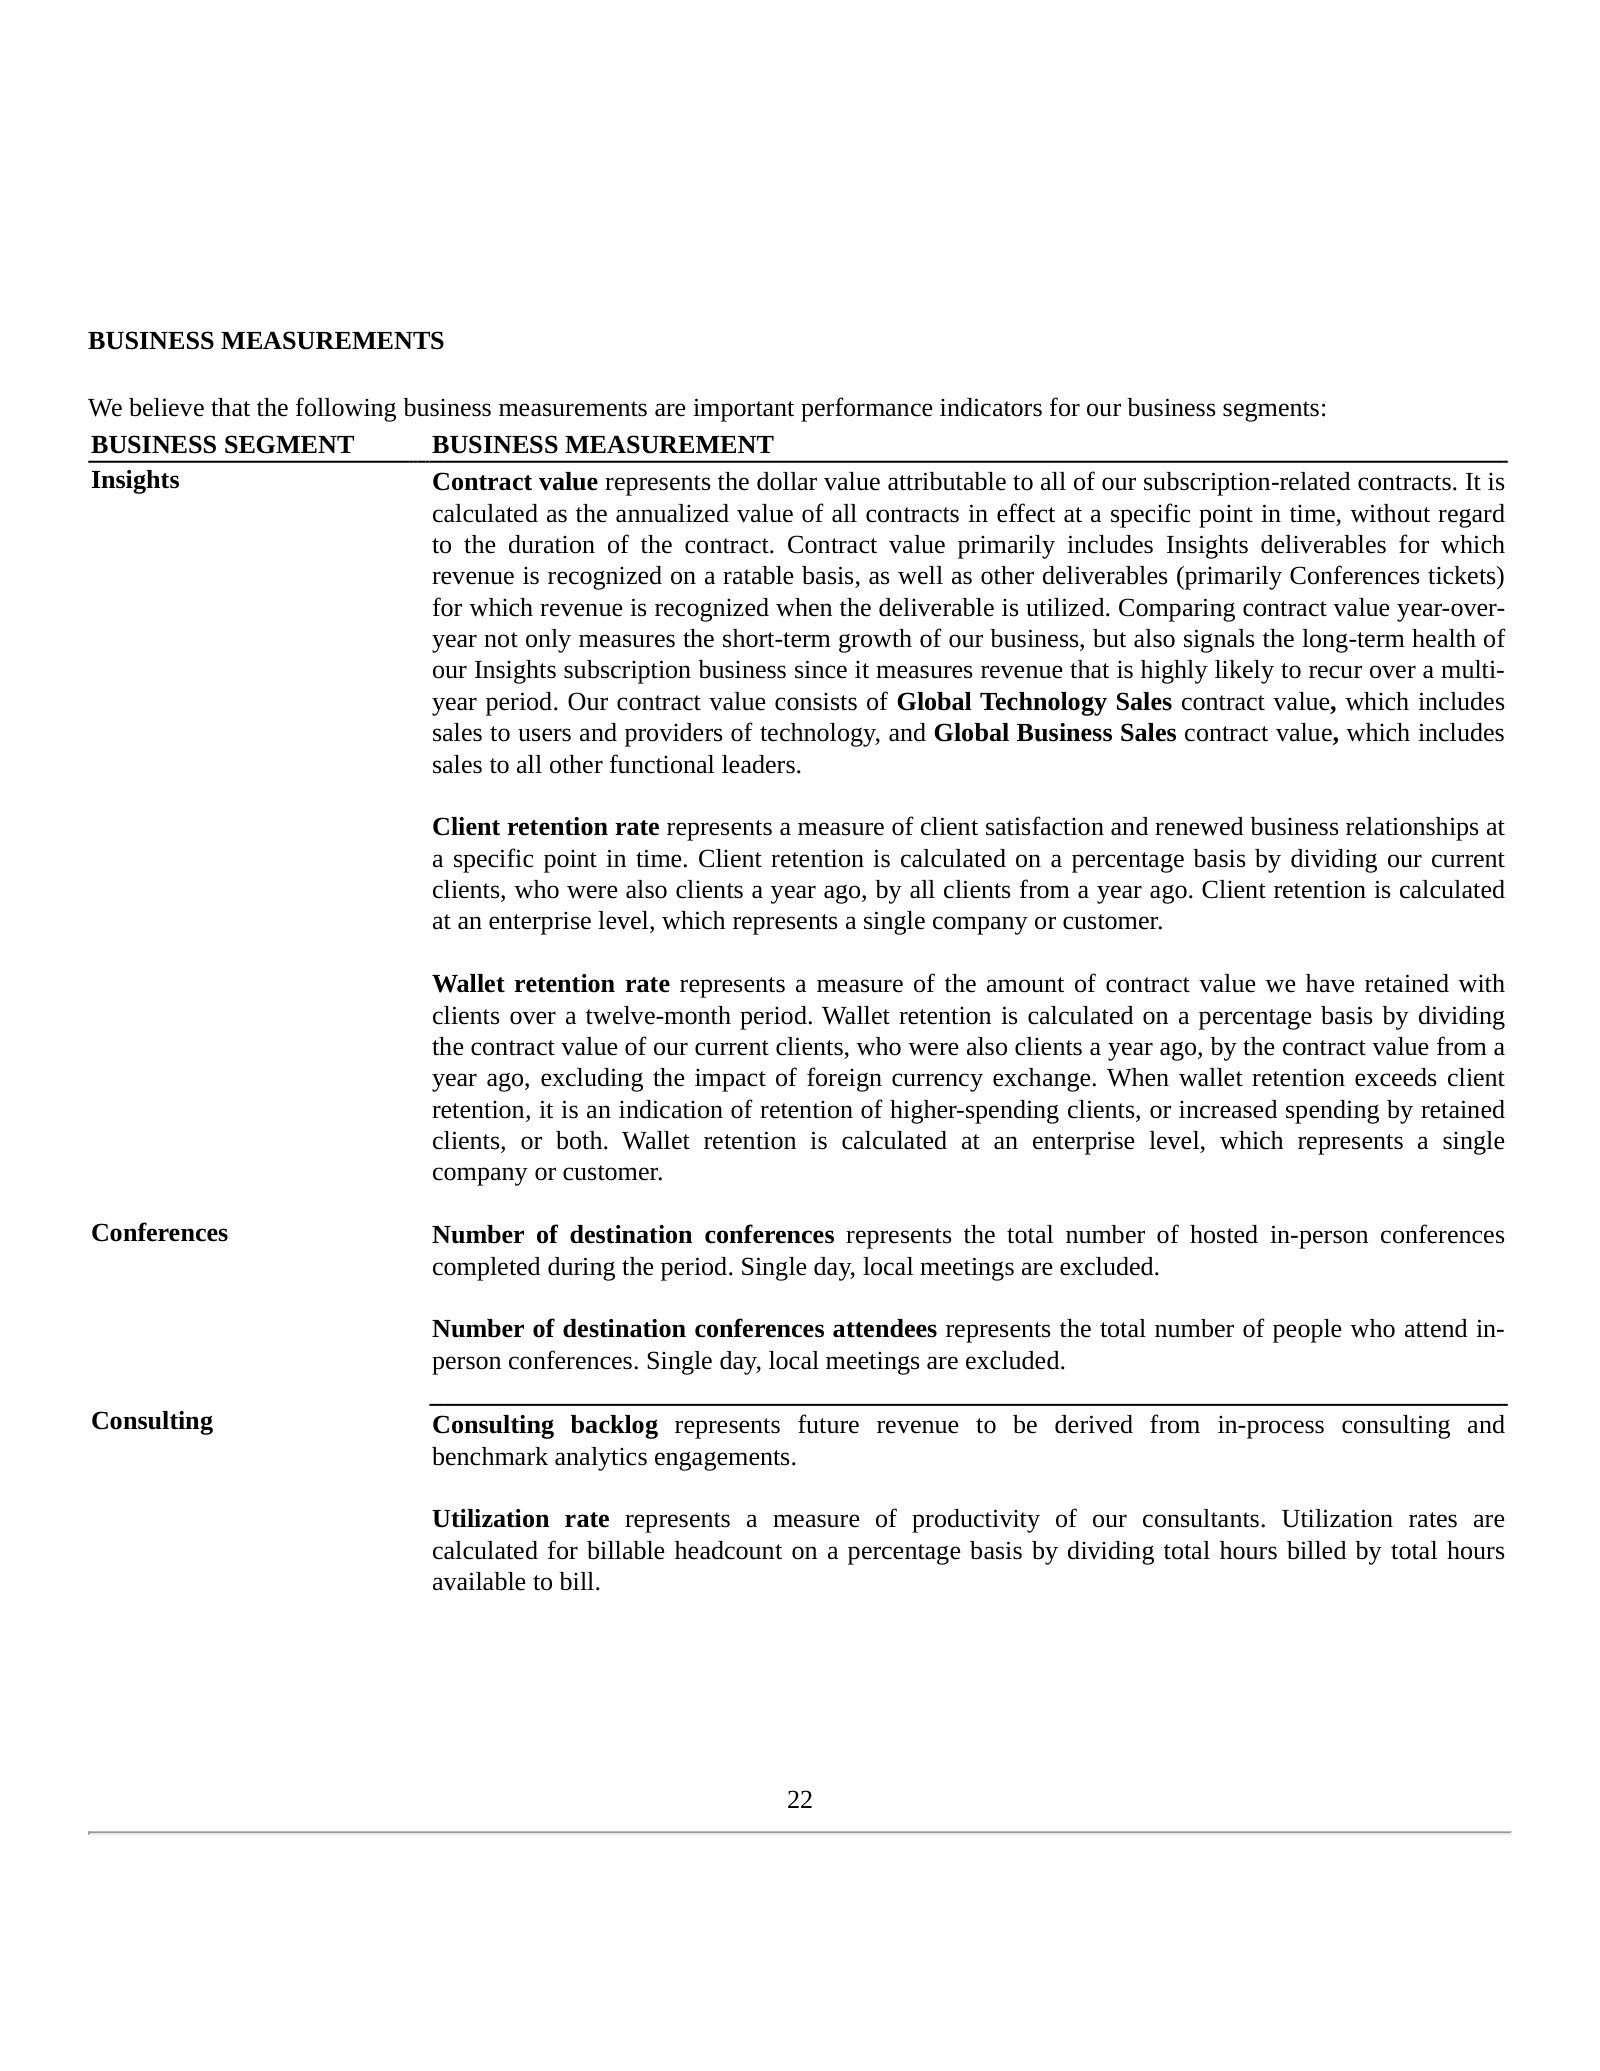
Executive summary of 2025 by segment — revenue up 4%, net income down 42% on a $150M goodwill impairment.
We had total revenues of $6.5 billion in 2025, an increase of 4% compared to 2024 on a reported basis and 3% excluding the foreign currency impact. Net income decreased to $0.7 billion in 2025 from $1.3 billion in 2024 and diluted earnings per share was $9.65 in 2025 compared to $16.00 in 2024. The decrease in 2025 is primarily due to the goodwill impairment loss in 2025, the gain on event cancellation insurance claims in 2024 and an increase in the provision for income taxes.
Insights revenues increased to $5.1 billion in 2025, an increase of 5% compared to 2024 on a reported basis and 4% excluding the foreign currency impact. The Insights gross contribution margin was 77% in both 2025 and 2024. Contract value was $5.2 billion at December 31, 2025, an increase of 1% compared to December 31, 2024 on a foreign currency neutral basis.
Conferences revenues increased to $644.7 million in 2025, an increase of 11% compared to 2024 on a reported basis and 9% excluding the foreign currency impact. The Conferences gross contribution margin was 50% and 48% in 2025 and 2024, respectively. We held 53 and 51 in-person conferences in 2025 and 2024, respectively.
Consulting revenues decreased to $552.5 million in 2025, a decrease of 1% compared to 2024 on a reported basis and 2% excluding the foreign currency impact. The Consulting gross contribution margin was 34% and 36% in 2025 and 2024, respectively. Backlog was $173.7 million at December 31, 2025.
Cash provided by operating activities was $1.3 billion and $1.5 billion during 2025 and 2024, respectively. As of December 31, 2025, we had $1.7 billion of cash and cash equivalents and approximately $1.0 billion of available borrowing capacity on our revolving credit facility. During 2025, we repurchased 7.0 million shares of the Company’s common stock for an aggregate purchase price of approximately $2.0 billion.
p. 42 · Read in context →
Reportable Segments — Insights — p. 51 · Read the full section →
The segment scorecard that carries the thesis: Insights revenue, 77% gross-contribution margin, Contract Value and GTS/GBS retention.
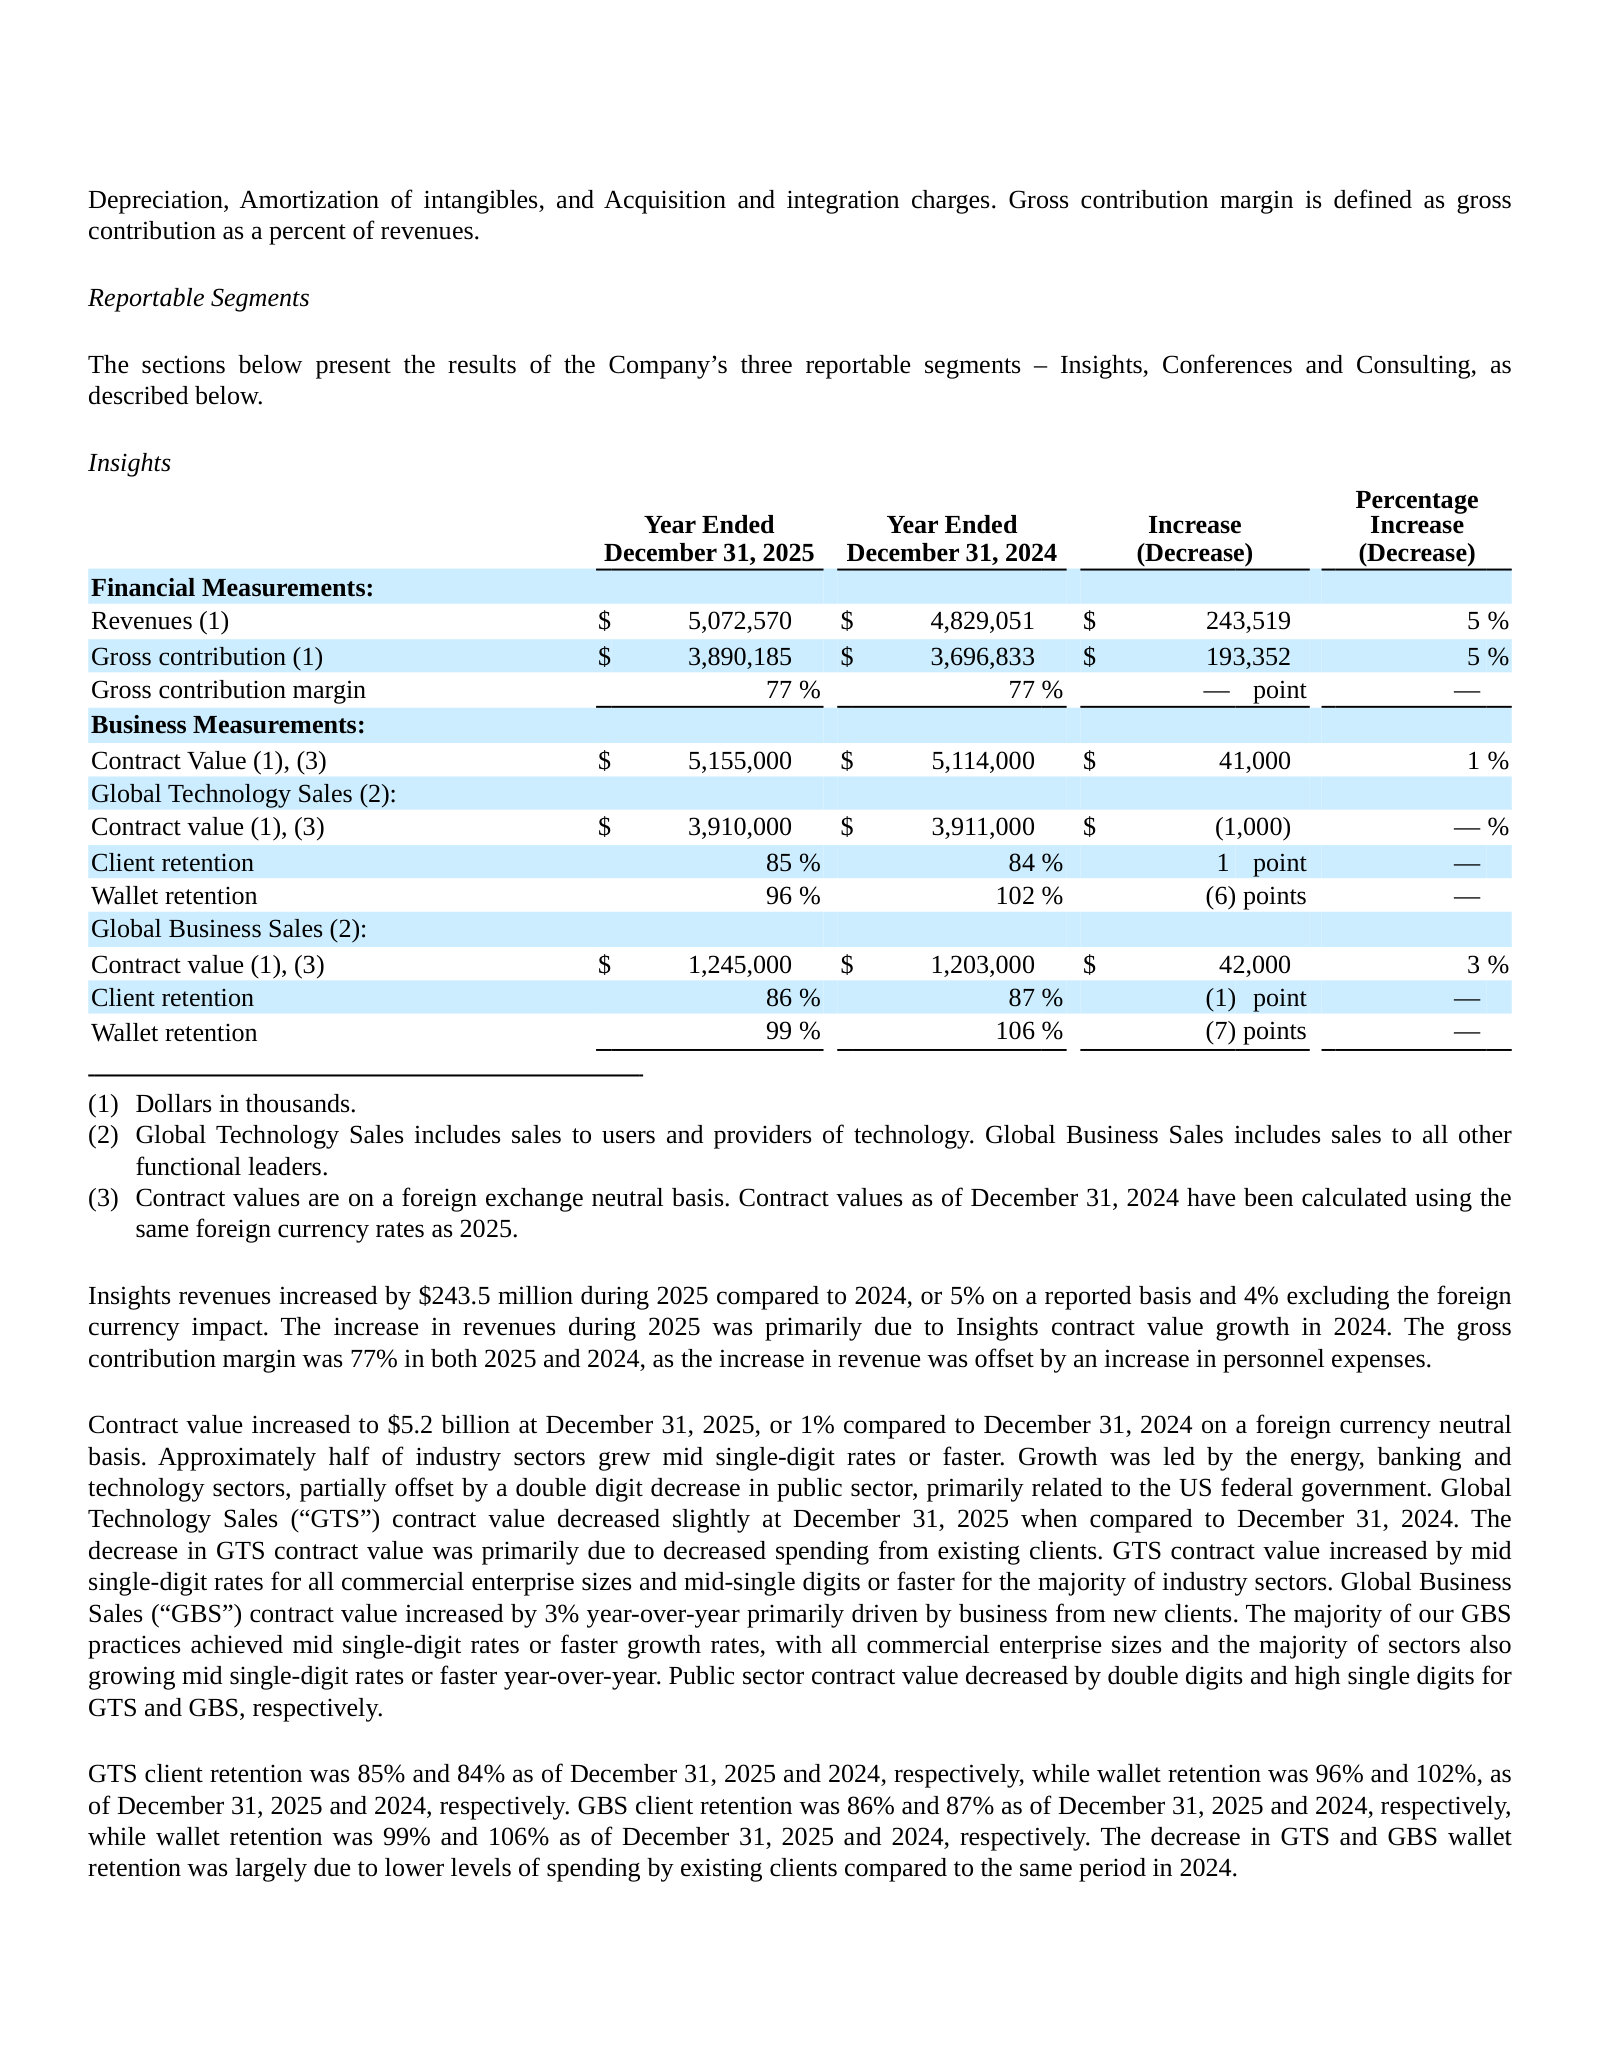
Note 9 — Revenue and Related Matters — p. 101 · Read the full section →
The accounting policy that defines the model: Insights revenue is deferred and recognized ratably over the contract term.
Subscription revenue is deferred and recognized ratably; 80–85% of contracts bill the first period upfront.
Insights revenues are derived from subscription contracts for insights products, representing substantially all of the segment’s revenue. The related revenues are deferred and recognized ratably over the applicable contract term (i.e., as services are provided over the contract period).
The Company enters into subscription contracts for published products that generally are for twelve-month periods or longer. Historically, approximately 80% to 85% of the Company’s annual and multi-year Insights subscription contracts provide for billing of the first full service period upon signing.
p. 101 · Read in context →
Gartner, Inc. — FY2021 Annual Report (Form 10-K) — FY2021
Included to show the pre-rename structure: the segment now called Insights was 'Research', and the client base was larger (15,000 vs 13,000). · Open the full document →
Item 1. Business — p. 4 · Read the full section →
Same three-segment architecture under the old 'Research' label — the baseline against which the 2025 rename and client-count shift read.
FY2021 framing: 15,000+ enterprises in ~100 countries; segments named Research, Conferences and Consulting.
We are a trusted advisor and an objective resource for more than 15,000 enterprises in approximately 100 countries and territories— across all major functions, in every industry and enterprise size.
Gartner delivers its products and services globally through three business segments – Research, Conferences and Consulting, as described below.
p. 4 · Read in context →
More annual reports
Gartner, Inc. — FY2024 Annual Report (Form 10-K) — FY2024 · 127 pages · The comparison year: net income of $1.3B boosted by a $300M event-cancellation insurance gain, before the 2025 rename. · Open →
Gartner, Inc. — FY2023 Annual Report (Form 10-K) — FY2023 · 128 pages · Post-pandemic normalization of in-person Conferences under the still-named Research segment. · Open →
Gartner, Inc. — FY2022 Annual Report (Form 10-K) — FY2022 · 127 pages · The recovery year as conferences returned in person; useful for tracing Contract Value growth. · Open →
Competitors describe Gartner, Inc.'s market in their own filings and calls. These verified passages and visual pages show where their strategies meet, using source documents preserved in Sources.
Forrester Research (FORR)
Gartner's closest listed pure-play — an independent syndicated research-and-advisory house built on the same subscription model and the same Research / Consulting / Events segment structure. It is the one peer that names Gartner in its own 10-K as a principal direct competitor, making it the cleanest read on the shared market.
Forrester names Gartner directly: in its own 10-K risk factors it identifies Gartner as a principal direct competitor in the market for research and advisory services — the rare instance of a peer putting the subject on the page by name.
We compete principally in the market for research and advisory services, with an emphasis on customer behavior and customer experience, and the impact of technology on our clients’ business and service models. Our principal direct competitors include other independent providers of research and advisory services, such as Gartner, as well as marketing agencies, general business consulting firms, and survey-based general market research firms. Some of our competitors have substantially greater financial and marketing resources than we do.
p. 13 · Read in context →
Forrester's flagship subscription research product, Forrester Decisions — its direct answer to Gartner's syndicated research seats, sold to the same 'business and technology leaders' and now wrapped with a generative-AI assistant.
Our primary subscription research service is Forrester Decisions. This portfolio of research services is designed to provide business and technology leaders with a proven path to growth through customer obsession.
p. 6 · Read in context →
Information Services Group (ISG) (III)
A Stamford, Connecticut-based (the same city as Gartner) technology research and advisory firm whose ISG Provider Lens evaluations and ISG Events map directly onto Gartner's Magic Quadrant research and Conferences franchises. It competes most sharply in IT sourcing, benchmarking and provider-selection advisory — the enterprise-decision-support market Gartner also serves.
ISG describes itself in the same terms Gartner uses for its own business — a technology research and advisory firm built on proprietary market data and research — and is headquartered in Stamford, Connecticut, Gartner's home city.
Information Services Group, Inc. (Nasdaq: III) is a global AI-centered technology research and advisory firm. A trusted partner to more than 900 clients, including 75 of the world’s top 100 enterprises, ISG is a long-time leader in technology and business services that is now at the forefront of leveraging AI to help organizations achieve operational excellence and faster growth.
p. 7 · Read in context →
ISG's research-and-events engine mirrors Gartner's two largest segments: its ISG Provider Lens provider-evaluation research is a structural analogue to Gartner's Magic Quadrant, and its sold-out ISG Events / AI Impact Summits play in the same conference market as Gartner's Conferences business.
Our ISG Research business delivered double-digit growth, led by our ISG Provider Lens® provider evaluation research and ISG Events. Client interest in AI-related content continues to rise, evidenced by our five sold-out AI Impact Summit events held across the globe in 2025.
p. 49 · Read in context →
ISG's own framing of the competitive field it shares with Gartner — a fragmented advisory sector where any provider of sourcing, benchmarking or IT-strategy advice, including large consulting firms and niche advisors, is a competitor.
The business information services and advisory sector is highly competitive, fragmented and subject to rapid change. […] Our competitors include any firm that provides sourcing or benchmarking advisory services, IT strategy or business process consulting, which may include a variety of consulting firms, service providers, niche advisors and, potentially, advisors currently or formerly employed by us.
p. 29 · Read in context →
Informa (INF)
Informa collides with Gartner on two fronts. Its majority-owned, Nasdaq-listed arm Informa TechTarget names Gartner directly as a specialist tech-research competitor, and the parent Informa PLC is the world's largest B2B live-events group — the closest scaled competitor to Gartner's Conferences segment.
Informa TechTarget lists Gartner first among the 'larger, established' specialist tech-research players it competes with, and states the basis on which it competes against them — a competitor's own map of the analyst-research field Gartner leads.
Informa TechTarget (Nasdaq: TTGT), Informa's majority-owned tech-research arm: Providers of specialist tech research include several larger, established players such as Gartner, IDC, Forrester, Frost and Sullivan, and others. We compete against these companies based on the specificity of our analysis, content creation capabilities, and analyst coverage against specific technology categories.
p. 17 · Read in context →
Informa TechTarget's sizing of the market it plays in — the intersection of technology and B2B marketing at roughly $20 billion a year. It is a broader pool than Gartner's IT research subscriptions, but one where specialist tech-research providers, Gartner among them, compete for the same technology-vendor and buyer budgets.
Informa TechTarget (Nasdaq: TTGT), Informa's majority-owned tech-research arm: We sit at the intersection of technology and B2B Marketing, a large and growing market worth an estimated $20 billion annually.
p. 17 · Read in context →
Informa PLC's stated scale in live events — the segment that competes with Gartner's Conferences business. The parent claims the leading global position in B2B Live Events with more than 800 brands, dwarfing Gartner's conference footprint in raw event scale even though Informa's events are largely trade exhibitions rather than Gartner's paid-analyst symposia.
Informa PLC (LSE: INF), parent group: Over the last 10+ years, Informa has built the leading position in B2B Live Events globally, including more than 800 specialist Brands serving 30+ growth market categories in all major geographic regions.
p. 4 · Read in context →
More peer documents
Forrester Research FY2024 Form 10-K — 102 pages · Prior-year filing carries the same 'principal direct competitors … such as Gartner' language plus the Research/Consulting/Events segment breakout, useful for tracking how the direct-competition framing has held year over year. · Open →
Information Services Group (ISG) FY2024 Form 10-K — 125 pages · Prior-year ISG 10-K details the ISG Index (its quarterly sourcing-market benchmark) and the sourcing-advisory competitive set, giving a second read on the IT-advisory market ISG shares with Gartner. · Open →
Informa PLC FY2025 results call (12 Mar 2026) — 24 pages · Management commentary on 'The Power of Live' and B2B Live Events growth quantifies the events-market momentum that frames Gartner's Conferences segment. · Open →
Clarivate FY2025 Form 10-K — 56 pages · Clarivate's stock-performance graph builds its peer index around Gartner, Moody's, MSCI, S&P Global, FactSet and Verisk — the market's info-services peer set for Gartner — though Clarivate's IP/life-sciences/academic subscriptions overlap little with Gartner's IT research directly. · Open →
S&P Global FY2025 Form 10-K — 220 pages · S&P Global Market Intelligence is the nearest analogue in subscription data-and-analytics scale, but serves financial-market rather than CIO/IT budgets — a valuation and business-model comparator rather than a direct research-and-advisory competitor. · Open →
Thomson Reuters FY2025 Form 10-K — 185 pages · Thomson Reuters' professional-information subscription franchise (legal, tax, corporates) is a recurring-revenue info-services peer; overlap with Gartner's IT research and CIO advisory is minimal, so it reads as an adjacent comp. · Open →
ISG Q4 FY2025 earnings call — 9 pages · ISG Index and ISG Research bookings commentary sizes the enterprise IT-services and sourcing demand backdrop that Gartner's research coverage tracks. · Open →
Source: S&P Capital IQ consensus via Xpressfeed · Generated 2026-07-29.
Gartner's consensus tape is a margin-and-capital-return story rather than a growth one: revenue is essentially flat — 2026 estimates sit below 2025's $6.5bn actual — yet normalized EPS is modeled to compound into the high-teens by 2028. The company has beaten normalized EPS eight quarters running while landing revenue within roughly 1.5% of consensus, and forward EPS estimates have drifted up over six months even as revenue estimates were cut. The street stays cautious, with most analysts at hold.
Forward estimates
EBITDA tracks the topline at roughly 10% two-year growth, so the far larger EPS climb points to share-count reduction and below-the-line leverage rather than margin expansion. Consensus models no dividend across the horizon.
Currency: USD · Scale: money in millions, absolute · YoY uses the prior fiscal year from the feed; analyst count and range use the first displayed period.
| Metric | FY2026E | FY2027E | FY2028E | YoY | Analysts | Low / high |
|---|---|---|---|---|---|---|
| Revenue | $6.43bn | $6.71bn | $7.06bn | -1.1% | 14 | $6.38bn / $6.47bn |
| EBITDA | $1.57bn | $1.64bn | $1.74bn | -2.3% | 12 | $1.54bn / $1.62bn |
| EPS (normalized) | $13.68 | $15.31 | $17.48 | +3.9% | 15 | $13.07 / $14.20 |
FY27 revenue estimates cut ~6% over six months while FY27 EPS drifted up ~4%
Over 180 days FY27 revenue fell from about $7,143M to $6,706M while FY27 normalized EPS rose from $14.76 to $15.31. FY28 was trimmed on both lines, revenue harder than EPS.
Currency: USD · Scale: money in millions, absolute · Point-in-time consensus; Δ90d is Now versus 90d.
| Metric | FY | 180d | 90d | 30d | Now | Δ90d |
|---|---|---|---|---|---|---|
| EPS (normalized) | FY2027 | $14.76 | $14.72 | $15.31 | $15.31 | +4.0% |
| EPS (normalized) | FY2028 | $18.72 | $16.75 | $17.60 | $17.48 | +4.4% |
| Revenue | FY2027 | $7.14bn | $6.82bn | $6.71bn | $6.71bn | -1.7% |
| Revenue | FY2028 | $7.94bn | $7.23bn | $7.07bn | $7.06bn | -2.3% |
Eight straight normalized-EPS beats while revenue prints within ~1.5% of consensus
Current sequences by metric: Revenue: 1 consecutive miss; EPS (normalized): 8 consecutive beats.
Currency: USD · Scale: money in millions, absolute · Consensus is captured before each actual first became effective.
| Quarter | Metric | Consensus | Actual | Surprise | Outcome |
|---|---|---|---|---|---|
| Q1 FY2026 | Revenue | $1.52bn | $1.51bn | -0.3% | Miss |
| Q1 FY2026 | EPS (normalized) | $2.92 | $3.32 | +13.6% | Beat |
| Q4 FY2025 | Revenue | $1.75bn | $1.75bn | +0.2% | Beat |
| Q4 FY2025 | EPS (normalized) | $3.51 | $3.94 | +12.2% | Beat |
| Q3 FY2025 | Revenue | $1.52bn | $1.52bn | +0.2% | Beat |
| Q3 FY2025 | EPS (normalized) | $2.43 | $2.76 | +13.7% | Beat |
| Q2 FY2025 | Revenue | $1.67bn | $1.69bn | +0.7% | Beat |
| Q2 FY2025 | EPS (normalized) | $3.31 | $3.53 | +6.8% | Beat |
| Q1 FY2025 | Revenue | $1.53bn | $1.53bn | -0.0% | Miss |
| Q1 FY2025 | EPS (normalized) | $2.72 | $2.98 | +9.7% | Beat |
| Q4 FY2024 | Revenue | $1.69bn | $1.72bn | +1.5% | Beat |
| Q4 FY2024 | EPS (normalized) | $3.26 | $5.45 | +67.2% | Beat |
| Q3 FY2024 | Revenue | $1.48bn | $1.48bn | +0.6% | Beat |
| Q3 FY2024 | EPS (normalized) | $2.37 | $2.50 | +5.6% | Beat |
| Q2 FY2024 | Revenue | $1.58bn | $1.60bn | +0.7% | Beat |
| Q2 FY2024 | EPS (normalized) | $3.03 | $3.22 | +6.4% | Beat |
Street snapshot
Currency: USD · Scale: money in millions, absolute · Analyst counts shown explicitly.
| Street view | Reading | Analysts |
|---|---|---|
| Recommendation mix | Buy 3, Outperform 0, Hold 10, Underperform 1, Sell 1 | 15 |
| Consensus score | 2.80 | 15 |
| Target price | mean $160.4; median $162.0; high $203.0; low $120.0 | 13 |
Where the street disagrees
Currency: USD · Scale: money in millions, absolute · Spread/mean is absolute high-low divided by absolute mean.
| Metric | Period | Mean | Low–high | Spread/mean | Analysts |
|---|---|---|---|---|---|
| EPS (normalized) | FY2028E | $17.48 | $15.68–$21.43 | 32.9% | 10 |
| EBITDA | FY2028E | $1.74bn | $1.55bn–$1.84bn | 16.8% | 10 |
Coverage thins sharply beyond 2028
Every FY2029 line rests on just two analysts, and FY2028 GAAP net income on six. Treat the 2028-2029 tails as directional rather than firm consensus.
Visible Alpha broker models via S&P Xpressfeed · 12 brokers · 360 line items · freshest revision 2026-07-23.
Broker models frame Gartner as a subscription-research franchise coming off a growth trough. Total revenue is roughly flat in FY-2026 before reaccelerating, but the leading indicator — contract value — is already inflecting up, driven by a swing back to positive net new business in the larger GTS book. The debate is not whether the book has turned but how fast, and the cash it throws off keeps compounding on a per-share basis.
Contract value, the leading indicator, is reaccelerating: +1.2% to +6.3% growth
GTS carries most of the book; GBS is smaller but modeled to grow faster. The net-add lines are the sharper story: GTS net contract value increase swings from negative in FY-2025 to a large positive by FY-2028.
| Line | FY-2025A | FY-2026E | FY-2027E | FY-2028E | YoY | Brokers |
|---|---|---|---|---|---|---|
| Book | — | — | — | — | — | — |
| Total contract value | $5.21bn | $5.51bn | $5.81bn | $6.18bn | +5.8% | 10 |
| Contract value - GTS | $3.94bn | $4.17bn | $4.37bn | $4.63bn | +5.9% | 10 |
| Contract value - GBS | $1.27bn | $1.34bn | $1.43bn | $1.55bn | +5.4% | 10 |
| Total contract value - YoY growth(%) | 1.2% | 3.6% | 5.4% | 6.3% | +2.5pt | 10 |
| Net adds | — | — | — | — | — | — |
| LTM Net contract value change(NCVI) | $58.90m | $183.16m | $305.20m | $369.78m | +211.0% | 10 |
| LTM Net contract value increase(NCVI) - GTS | $-14.52m | $112.14m | $195.04m | $246.75m | +872.5% | 10 |
| LTM Net contract value increase(NCVI) - GBS | $56.97m | $64.92m | $97.46m | $111.68m | +14.0% | 11 |
Insights compounds and Conferences rebuilds; Consulting is the drag on flat FY-2026 revenue
Insights (research) is the compounder and the bulk of revenue. Consulting is modeled down about 11% in FY-2026 and never fully recovers; Conferences keeps rebuilding.
| Line | FY-2025A | FY-2026E | FY-2027E | FY-2028E | YoY | Brokers |
|---|---|---|---|---|---|---|
| Total revenue | $6.49bn | $6.43bn | $6.72bn | $7.11bn | -1.0% | 12 |
| Total revenue - Insights | $5.07bn | $5.20bn | $5.45bn | $5.77bn | +2.6% | 11 |
| Total revenue - Conferences | $632.10m | $697.22m | $744.44m | $800.27m | +10.3% | 11 |
| Total revenue - Consulting | $576.27m | $511.23m | $529.73m | $548.96m | -11.3% | 11 |
Brokers agree the GTS book has turned up; they split on how fast
The dispersion sits on the exact line that drives the reacceleration thesis, not on the headline P&L.
| Line | Period | Median | Q1–Q3 | Min–max | Brokers |
|---|---|---|---|---|---|
| LTM Net contract value increase(NCVI) - GTS | FY-2027E | $207.97m | $170.67m–$245.29m | $102.52m–$268.62m | 9 |
| LTM Net contract value increase(NCVI) - GTS | FY-2028E | $262.67m | $225.18m–$284.06m | $115.98m–$330.09m | 7 |
| LTM Net contract value change(NCVI) | FY-2027E | $313.04m | $280.20m–$344.15m | $180.04m–$400.14m | 8 |
Free cash flow per share climbs from $15.3 to $22.7 across the forecast
Operating EBITDA is near-flat in FY-2026 then grows; the per-share cash line rises faster than the dollar total as the share count shrinks.
| Line | FY-2025A | FY-2026E | FY-2027E | FY-2028E | YoY | Brokers |
|---|---|---|---|---|---|---|
| Free cash flow | $1.16bn | $1.16bn | $1.23bn | $1.34bn | +0.0% | 12 |
| Free cash flow per share($) | $15.30 | $17.22 | $19.63 | $22.65 | +12.5% | 11 |
| EBITDA - Operating | $1.59bn | $1.58bn | $1.65bn | $1.77bn | -0.8% | 12 |
Operating KPIs rest on thin broker coverage; one derived line is unusable
Retention rates, contract value per enterprise and client-enterprise counts are modeled by only one to three brokers, so read them as one analyst's view rather than consensus. The "conferences revenue per attendee" line is on a broken scale and should be ignored. Headline revenue, CV and cash lines carry far deeper coverage (up to 12 brokers) with revisions dated mid-2026.
Headline P&L consensus, momentum and beat/miss live in the CapIQ tab.
Source: S&P Capital IQ transcripts via Xpressfeed · latest indexed call 2026-05-05 · generated 2026-07-29.
Latest call digest
Gartner, Inc., Q1 2026 Earnings Call, May 05, 2026 · 2026-05-05T12:00:00
Q1 2026 (reported May 5, 2026). The prepared remarks were an "ahead of expectations" quarter wrapped around a soft spot: insights revenue, EBITDA, adjusted EPS and free cash flow all beat, adjusted EPS was $3.32 (up 11%) and free cash flow rose 29%, and Gartner raised full-year EBITDA, EPS and FCF guidance to at or above $1.545 billion, $13.25 and $1.16 billion. But contract value grew only 1% year-over-year (3.5% ex-U.S. federal), and management flagged that after a strong January and February, client decisions "slowed somewhat in March" on the geopolitical environment. Capital return stayed front and center — $535 million of buybacks cut the share count ~4% — and both Hall and Safian anchored the story on delivering adjusted EPS growth above 12% on a compound basis over three years (2025 base).
The Q&A reality was more probing. Analysts pressed repeatedly on why CV sits so far below Gartner's historical high-single/low-double-digit range and when it re-accelerates; management pointed to the ~250 bps U.S. federal headwind (which laps from Q2) and reiterated that CV will "accelerate over the course of 2026" while declining to guide it. Hall said many deals that slipped in March closed in April, framing the weakness as longer cycles rather than lost demand. On pricing, management firmly rejected intra-quarter speculation that sellers were discounting below the ~$50,000 ASP — "we do not offer discounts." Consulting and contract optimization were softer, which management tied to the same deferral behavior rather than anything structural.
Participant coverage from the latest call.
| Group | Participants | Count |
|---|---|---|
| Management | David Cohen — Senior Vice President of Investor Relations, Gartner, Inc.; Eugene Hall — CEO & Chairman, Gartner, Inc.; Craig Safian — Executive VP & CFO, Gartner, Inc.; Operator | 4 |
| Analysts | Jeffrey Meuler — Senior Research Analyst, Robert W. Baird & Co. Incorporated, Research Division; Faiza Alwy — Research Analyst, Deutsche Bank AG, Research Division; Andrew Nicholas — Analyst, William Blair & Company L.L.C., Research Division; Jason Haas — Executive Director & Senior Equity Analyst, Wells Fargo Securities, LLC, Research Division; Surinder Thind — Equity Analyst, Jefferies LLC, Research Division; Joshua Chan — Analyst, UBS Investment Bank, Research Division; Toni Kaplan — Senior Analyst, Morgan Stanley, Research Division; Keen Fai Tong — Research Analyst, Goldman Sachs Group, Inc., Research Division; Jeffrey Silber — MD & Senior Equity Analyst, BMO Capital Markets Equity Research; Jasper Bibb — VP of Equity Research, Truist Securities, Inc., Research Division; Scott Wurtzel — Research Analyst, Wolfe Research, LLC; Ashish Sabadra — Analyst, RBC Capital Markets, Research Division; Wahid Amin — Former Research Analyst, BofA Securities, Research Division | 13 |
Curated latest-call exchanges; one row per analyst topic.
| Analyst | Firm | Topic | What changed in Q&A |
|---|---|---|---|
| Jeffrey Meuler | Robert W. Baird & Co. | March slowdown and April recovery | Asked whether March-delayed deals are converting in April; Hall said many are closing and the new-business softness was broad-based across both new logos and existing clients. |
| Faiza Alwy | Deutsche Bank | Regional slowdown and pricing | Slowdown was worst in directly-impacted areas such as airlines/transportation and the Gulf Cooperation Council; Hall said pricing is unchanged and clients view it as appropriate. |
| Andrew Nicholas | William Blair | U.S. federal headwind and sales-headcount mix | Federal was a 250 bps CV headwind that laps starting Q2; Safian said 2026 hiring skews toward business developers over account managers. |
| Keen Fai Tong | Goldman Sachs | Why CV is below historical levels | Safian named U.S. federal as the dominant headwind and reiterated expected CV acceleration but would not guide a specific exit rate. |
| Joshua Chan | UBS | Drivers of the >12% EPS CAGR | Pressed on how the CAGR works with sub-target revenue growth; Safian pointed to margin expansion and buybacks (roughly $2.4-2.5 billion repurchased over the last 12 months). |
| Jasper Bibb | Truist Securities | Discounting speculation | Asked about intra-quarter talk of below-ASP offers on new licensed users; Safian flatly denied any change in discounting posture or philosophy. |
Theme tracker
Themes are curator-classified across supplied calls.
| Theme | Status | Quarters mentioned | Read-through |
|---|---|---|---|
| AI as demand tailwind and substitution risk | persisted | Q2 2023, Q4 2024, Q1 2025, Q2 2025, Q3 2025, Q4 2025, Q1 2026 | Consistently framed as Gartner's top demand topic and the engine behind AskGartner; management tracks AI-as-substitute losses at the deal level and repeatedly calls them essentially unmeasurable. |
| U.S. federal / DOGE headwind | emerged | Q1 2025, Q2 2025, Q3 2025, Q4 2025, Q1 2026 | Absent before 2025, it became the single largest drag at roughly a 250 bps CV headwind; the base was rebuilt to about $114-126 million and management expects it to lap from Q2 2026. |
| Tariffs, cost-cutting and longer sales cycles | persisted | Q1 2025, Q2 2025, Q3 2025, Q4 2025, Q1 2026 | Escalation of routine buying decisions to the CFO/CEO and stretched sales cycles recurred all year; by Q1 2026 tariffs had 'stabilized' and 'geopolitical' became the new headline factor. |
| BTI transformation and AskGartner | emerged | Q2 2025, Q3 2025, Q4 2025, Q1 2026 | AskGartner rolled out to all licensed users through 2025; the four-dimension transformation (impact, volume, timeliness, user experience) is management's central self-help lever for re-accelerating engagement, retention and CV. |
| Tech vendor mix - software/services vs hardware | persisted | Q2 2023, Q1 2025, Q3 2025, Q1 2026 | Software and services grew high-single to low-double digits while hardware, semis and telecom lagged; the split recurred every quarter and small tech vendor churn kept enterprise counts under pressure. |
| Buybacks and share-count reduction | persisted | Q2 2023, Q1 2025, Q2 2025, Q3 2025, Q4 2025, Q1 2026 | Repurchase pace stepped up sharply in 2025 (about $2 billion, aided by an inaugural investment-grade bond) and is now the primary lever behind the >12% EPS CAGR pledge. |
| Double-digit CV growth pledge | persisted | Q1 2025, Q2 2025, Q3 2025, Q4 2025, Q1 2026 | The 12%-16% medium-term target stayed on the table, but the dated 'clear path back to double-digit growth' language of mid-2025 softened to 'CV will accelerate' as growth stalled near 1%. |
Guidance ledger
Quotes, calls, and speakers are source-verified; outcomes are curator-classified.
| Verbatim guidance | Call | Speaker | Curator outcome | Outcome note |
|---|---|---|---|---|
| “We expect 2025 adjusted EPS of at least $11.70, up about $0.25 from last quarter.” | Gartner, Inc., Q1 2025 Earnings Call, May 06, 2025 · 2025-05-06T12:00:00 | Craig Safian | kept | FY2025 adjusted EPS finished at $13.17, well above this floor as guidance was raised through the year. |
| “All these factors would get us to at least high single-digit growth in 2026, well on our way back to double-digit growth in 2027 and beyond.” | Gartner, Inc., Q2 2025 Earnings Call, Aug 05, 2025 · 2025-08-05T12:00:00 | Craig Safian | pending | Q1 2026 CV grew just 1% (3.5% ex-U.S. federal), a wide gap to the high-single-digit full-year target with three quarters left. |
| “We expect 2025 adjusted EPS of at least $12.65, an increase from last quarter.” | Gartner, Inc., Q3 2025 Earnings Call, Nov 04, 2025 · 2025-11-04T13:00:00 | Craig Safian | kept | FY2025 adjusted EPS came in at $13.17, above this floor. |
| “We expect 2026 adjusted EPS of $12.30 or more.” | Gartner, Inc., Q4 2025 Earnings Call, Feb 03, 2026 · 2026-02-03T13:00:00 | Craig Safian | pending | Raised one quarter later to at or above $13.25 on the Q1 2026 call, reflecting higher EBITDA and a lower share count. |
| “We expect 2026 adjusted EPS at or above $13.25” | Gartner, Inc., Q1 2026 Earnings Call, May 05, 2026 · 2026-05-05T12:00:00 | Craig Safian | pending | Raised from the $12.30 or more guided in Q4 2025; primarily reflects the higher EBITDA outlook and a lower share count. |
| “we expect to deliver adjusted EPS on a compound annual basis above 12% over the next 3 years” | Gartner, Inc., Q1 2026 Earnings Call, May 05, 2026 · 2026-05-05T12:00:00 | Eugene Hall | pending | Off a 2025 base (confirmed later in the call); management leans on margin expansion and buybacks given CV growth near 1%. |
Q&A pressure map
Question counts and firms are curator tallies; analyst coverage shown above.
| Topic | Questions | Firms | Pressure / response |
|---|---|---|---|
| CV re-acceleration - timing, pacing and drivers | 5 | Jefferies, Wells Fargo, Goldman Sachs, Truist Securities | The single most-pressed topic on the Q1 2026 call and on every recent call; management declined to guide CV and repeated only that it will accelerate over the course of 2026. |
| Selling environment and the March decision slowdown | 3 | Robert W. Baird & Co., Deutsche Bank, UBS | Analysts probed whether the March weakness was macro or structural; management said deals slipped rather than were lost and many closed in April. |
| Pricing and discounting | 2 | Deutsche Bank, Truist Securities | Pressed on intra-quarter speculation of below-ASP offers; management addressed it directly and denied any change, saying it does not offer discounts. |
| U.S. federal / DOGE headwind and its lapping | 1 | William Blair | A recurring pressure point every quarter since early 2025; on the latest call management reiterated the ~250 bps drag lapses from Q2 2026 with the base rebuilt near $114 million. |
Language shifts
Only language evidence verified against the referenced component is shown.
| Observation | Verbatim evidence | Call ID | Component |
|---|---|---|---|
| Tone on the macro hardened from early-2025 'resilient in a complex environment' to describing a structurally tougher backdrop assumed to persist. | “This makes for a much tougher selling environment.” | 1978890155 | 1 |
| A notably more permanent framing of disruption than the 'return to normal' language used earlier in 2025. | “we should assume that the world is going to be like this forever, that there's going to be a lot more disruption and chaos” | 1978890155 | 16 |
| The confident 'clear path back to double-digit growth' refrain of mid-2025 gave way by Q1 2026 to a more buyback-anchored EPS-CAGR pledge as CV growth stalled near 1%. | “we're making adaptations that give us a clear path back to double-digit growth” | 1954175581 | 1 |
| 'Geopolitical' replaced 'tariffs' and 'DOGE' as the headline external factor cited for the latest slowdown. | “Due to changes in the geopolitical environment, client decisions slowed somewhat in March.” | 1996258445 | 1 |
The call history traces a steady deceleration - CV growth sliding from high-single digits in 2023 to about 1% by Q1 2026 - met by a consistent management response: reframe the macro as permanent, lean on the BTI/AskGartner transformation and heavy buybacks, and shift the headline promise from double-digit CV growth to a buyback-aided >12% EPS CAGR. The open debate is whether the pledged CV re-acceleration is a matter of timing (federal lapping, transformation maturing) or a more durable ceiling on the seat-based model; so far the calls show more evidence of resilient retention and rising engagement than of the inflection itself.